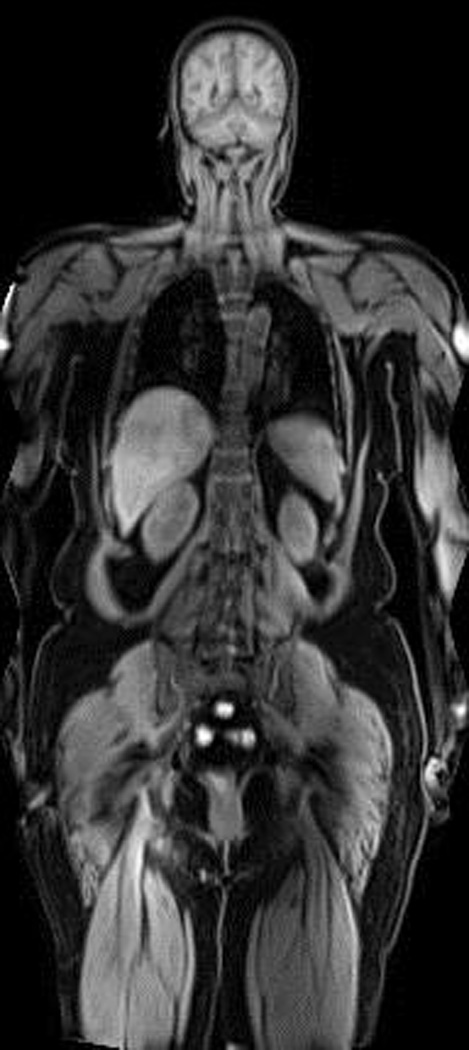
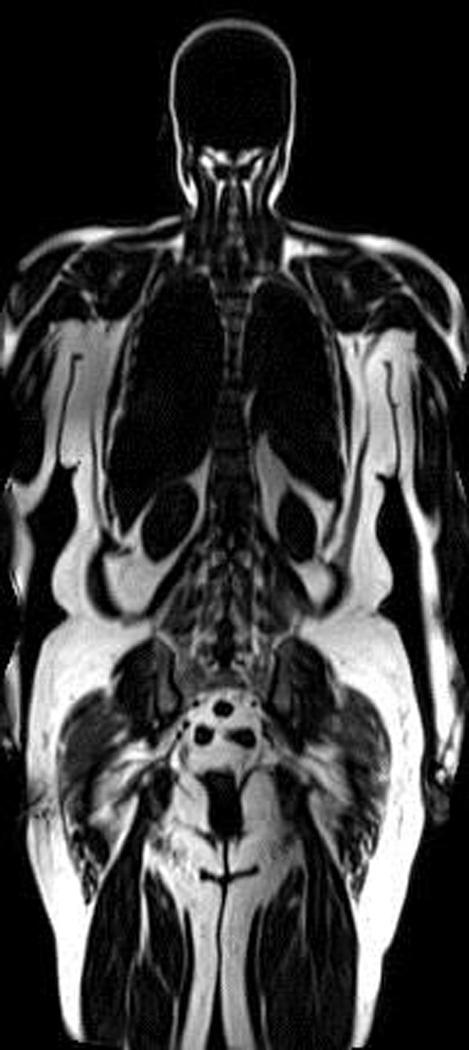
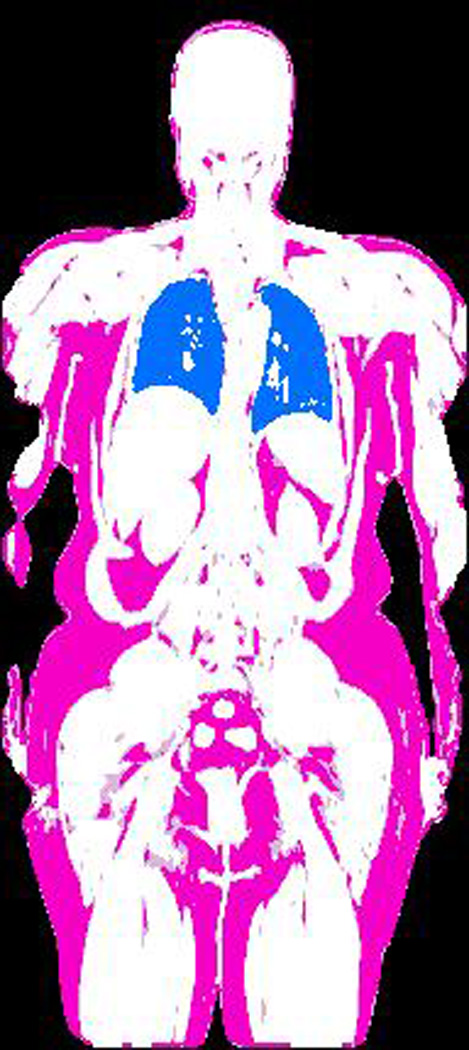
Figure 2.


MR-AC data generated by the two-point Dixon method. From left to right: a) water image, b) fat image, and c) segmented four-class attenuation map (lean tissue = white, adipose tissue = pink, lung = blue, air = black). Note that the automated algorithm does not attempt to identify bone (given lack of bone information in Dixon) and defaults to treating it as water.
