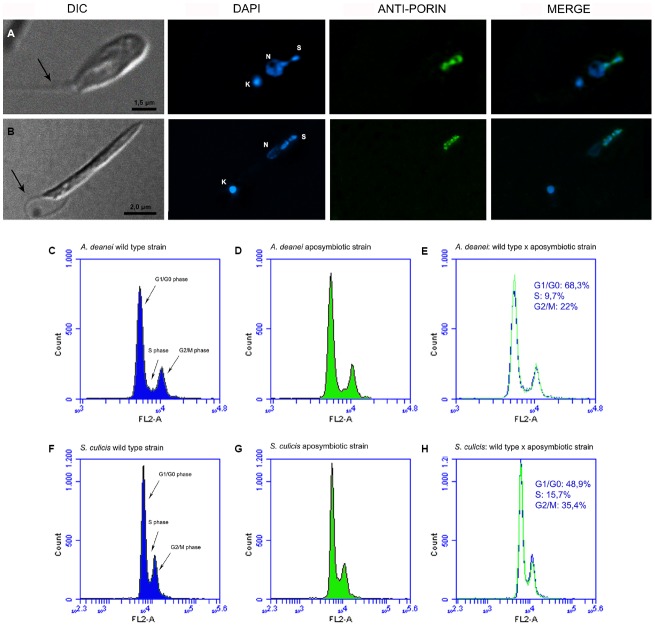
FIGURE 1.
Cell cycle in control cells. The top panels show optical microscopy images of A. deanei (A) and S. culicis (B) observed by differential interference contrast (DIC) and fluorescence microscopy after staining with DAPI and anti-porin, a specific antibody that labels the symbiont. The black arrow indicates the flagellum. The bottom panels show the flow cytometry histograms of wild-type, aposymbiotic strains and the merged analyses of A. deanei (C–E) and S. culicis (F–H). The sizes of the scale bars are indicated in each figure.

