
FIGURE 3.
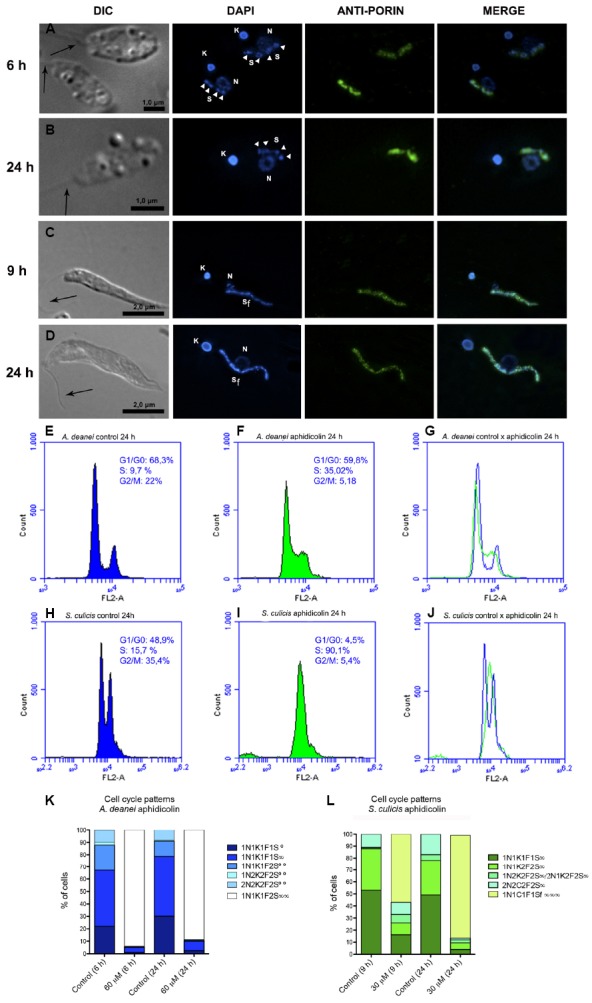
Aphidicolin affects symbiont division in A. deanei and S. culicis. The top panels show optical micrographs of A. deanei (A,B) and S. culicis (C,D) treated with 60 μM and 30 μM aphidicolin up to 24 h, respectively, and labeled with DAPI and anti-porin. The black arrows indicate the flagellum, and the white arrowheads indicate the symbiont’s nucleoids. The sizes of the scale bars are indicated in each figure. The middle panels show flow cytometry histograms of control A. deanei (E) and S. culicis (H), or cells treated for 24 h with 60 μM (F) or 30 μM (I) aphidicolin, respectively. Merged histograms are represented on the right (G,J). The bottom panel represents the cell pattern distribution generated by counting DNA-containing structures of A. deanei (K) and S. culicis (L) after the indicated treatments. F, flagellum; K, kinetoplast; N, nucleus; S, symbiont. S∞—a single symbiont in rod shape per cell, S∞—a single symbiont in constriction (dividing format) per cell, S∞∞—two symbionts in rod shape per cell, S∞∞—filamentous symbiont.