
FIGURE 4.
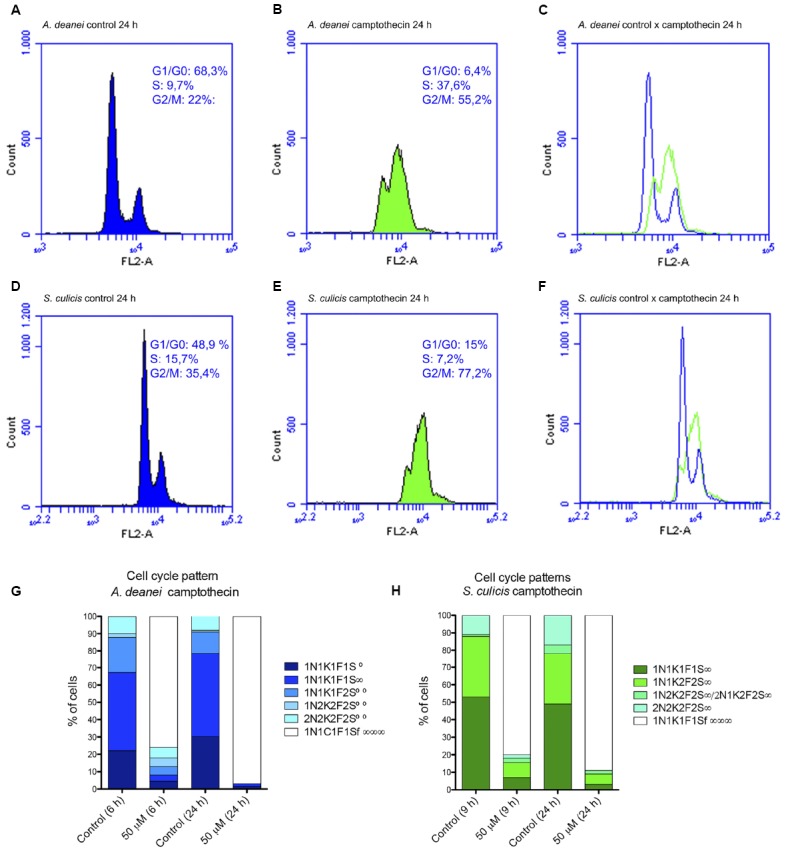
The top panel shows flow cytometry histograms of control A. deanei (A) and S. culicis (D), or cells treated for 24 h with 10 μM camptothecin (B,E). Merged histograms are represented on the right (C,F). The bottom panel represents the cell pattern distribution generated by counting DNA-containing structures of A. deanei (G) and S. culicis (H) after the indicated treatments. F, flagellum; K, kinetoplast; N, nucleus; S, symbiont. S∞—a single symbiont in rod shape per cell, S∞—a single symbiont in constriction (dividing format) per cell, S∞∞—two symbionts in rod shape per cell, S∞∞∞—filamentous symbiont.