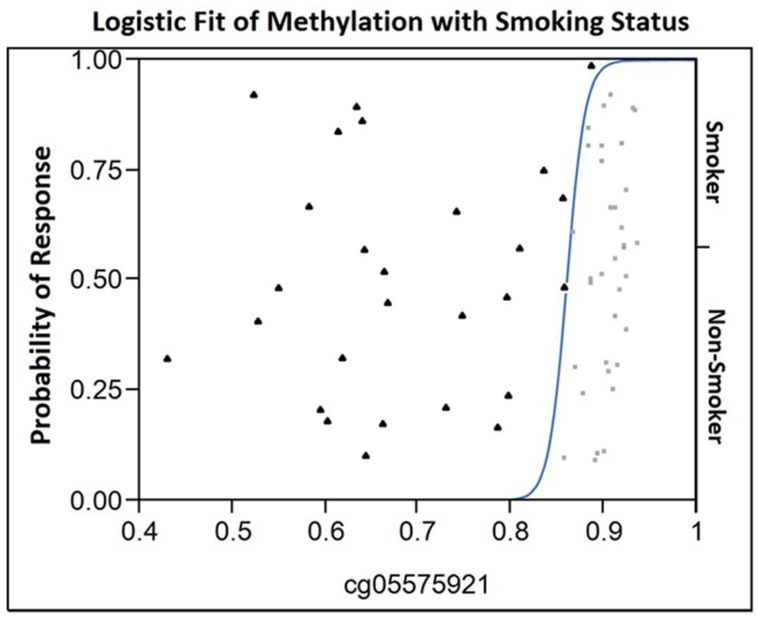
FIGURE 1.
The Logistic Fit plot of the relationship between methylation at cg05575921 and smoking status. Observed cg05575921 methylation for each 61 subjects in the study is shown on the X-axis (smokers are represented by a filled triangle, non-smokers by a light gray box) with their position on the Y-axis not having meaning. In contrast, the position on the Y-axis with respect to the fitted curve indicates the probability for each response (either smoker or non-smoker) for a given value on the X-axis. In essence, for those subjects with a methylation level less than 0.82 have essentially no chance of being in the non-smoker group. At a methylation level of approximately 0.85, the probability of being a smoker is approximately 0.75 and the probability of being a non-smoker is 0.25. Then, the probability of being non-smoker then rises as a function of increasing methylation becoming virtually certain at levels of 0.9 or greater.

