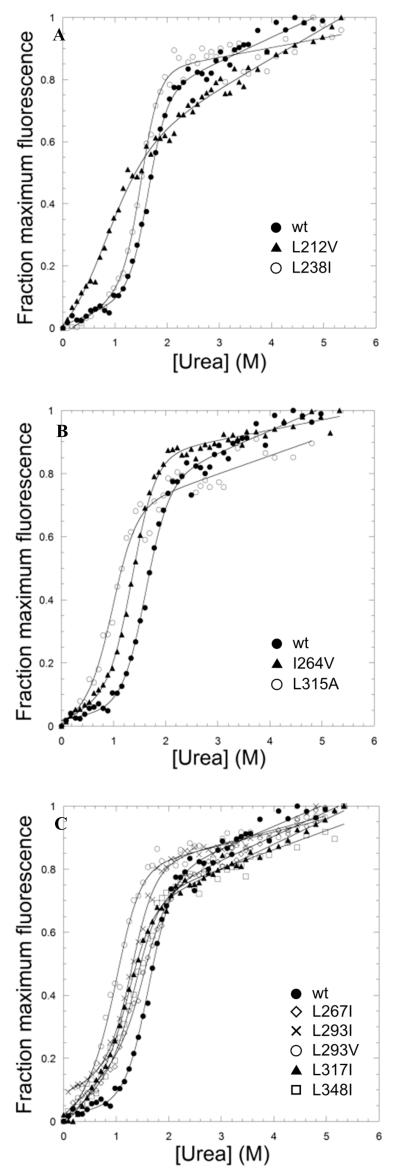
Figure 4. Equilibrium denaturation curves of TAPLRR mutants.
(A) Mutations in the N-terminal helical cap, L212V (triangles) and L238I (open circles). (B) Mutations in equivalent positions of repeat 1 (I264V) and repeat 3 (L315A) shown by triangles and open circles, respectively. (C) Mutations in equivalent positions of all repeats. L267I in repeat 1 is shown by open diamonds, L293I and L293V in repeat 2 are shown by crosses and open circles, respectively. L317I in repeat 3 is shown by triangles. L348I in repeat 4 is shown by squares. The denaturation curve of wild-type TAPLRR is shown by closed circles in all panels for comparison. The data were fitted to a two-state equation as for Figure 2.

