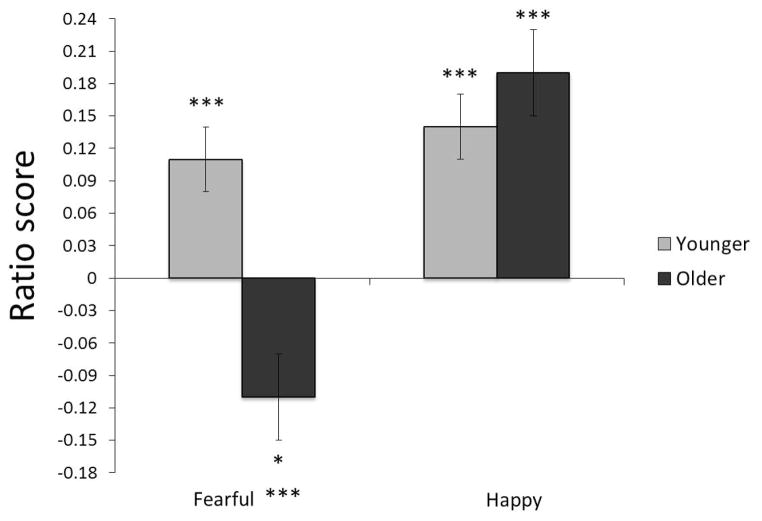
Figure 2.
Fixation ratios by age group and emotional face type (fearful, happy). Bars indicate standard errors. Notations of significance (*p < .05, ***p < .001) next to each bar indicate that the ratio score for that condition is significantly different from zero. Notations of significance next to the label for an emotional face type indicate a significant difference between age groups for that face type.

