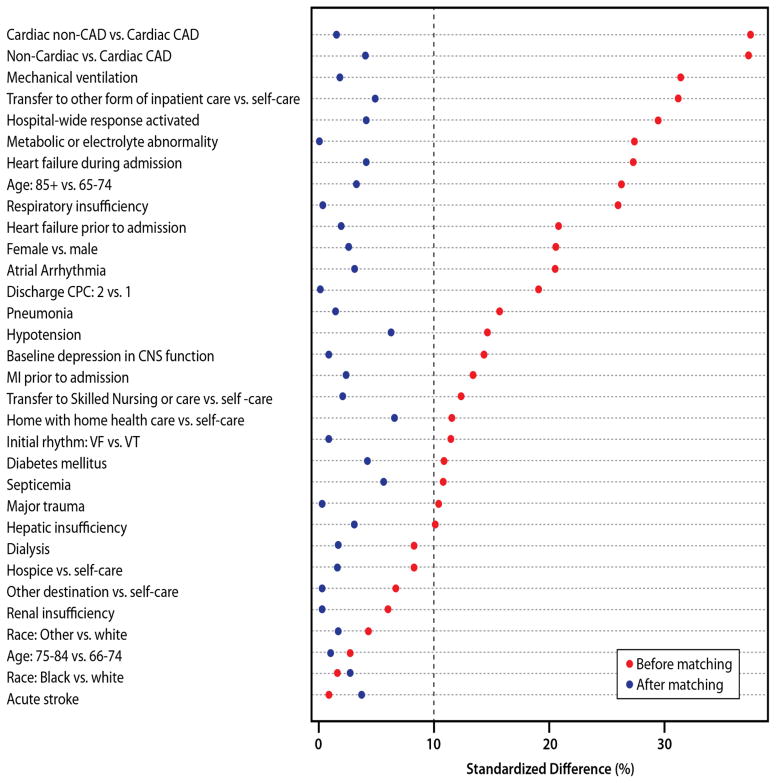
Figure 2. Covariate Balance Between ICD Groups Before and After Propensity Score Matching.
Significant differences (standardized difference [SD] >10%) in characteristics existed between ICD and non-ICD patients prior to propensity score matching. After the match, all characteristics were balanced (SD <10%) between the ICD and non-ICD groups. Covariates are ranked by magnitude of standardized differences prior to propensity score matching.

