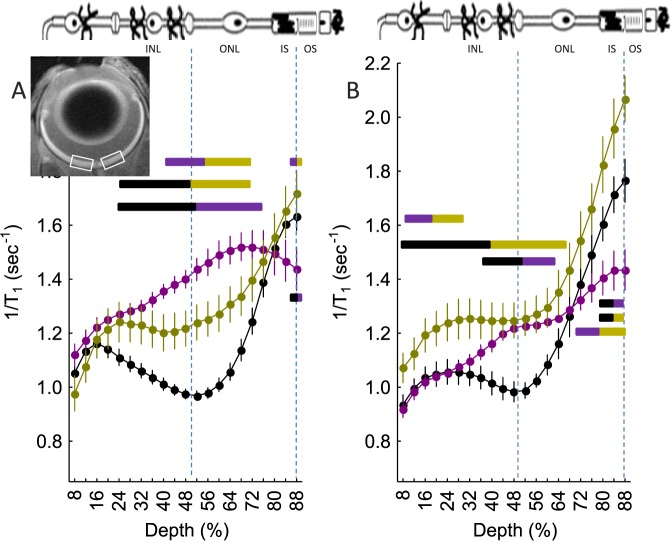
Figure 1.
Degree of retinal LTCC opening as measured by extent of manganese uptake in vivo and impact of DIL: central (±0.4–1.0 mm from the optic nerve head, illustrated by the white boxes in the inset image) retinal manganese uptake (as evaluated via 1/T1) profiles of (A) dark-adapted wt mice (closed black circles, n = 19), Cav1.4−/− mice (closed gold circles, n = 5), Arr1−/− mice (closed magenta circles, n = 5), and (B) DIL-treated wt, Cav1.4−/−, and Arr1−/− mice (color scheme as in [A]). Data are shown as a function of distance from the retina/nonretina borders, where 0% is the vitreous/retina border and 100% is the retina/choroid border. Regions near borders are not shown because these regions likely include some signal from outside of the retina (i.e., partial volume averaging with vitreous or choroid/sclera). Bicolored lines above profiles indicate retinal regions with significant (P < 0.05) differences in manganese uptake between control and experimental mice indicated by the color. Above graph: Simplified schematic of retina and support circulations.66–68 The retina has a well-defined laminar structure that allows us to reasonably label, on high-resolution MEMRI (21.9-μm axial resolution),23 regions of uptake at 24% to 50% depth as the inner nuclear layer, at 50% to 68% depth as rod nuclei, at 68% to 88% depth as the rod inner segment region, and >88% as the rod outer segment region.

