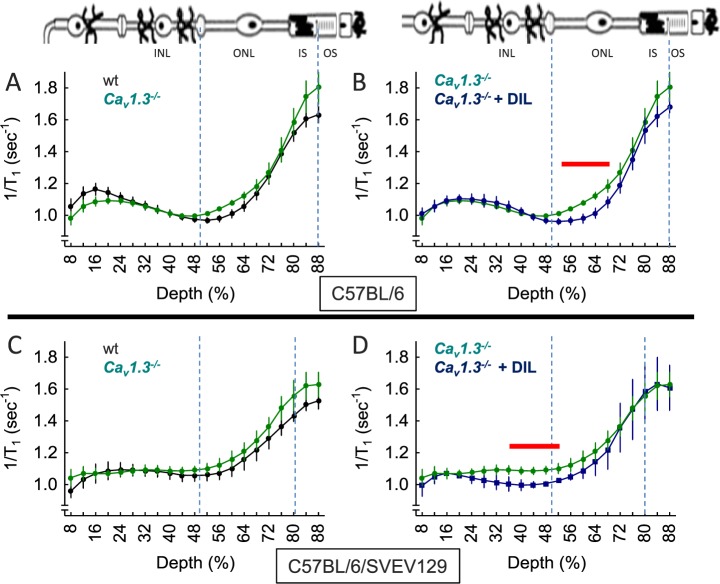
Figure 2.
Extent of LTCC opening as measured by MEMRI in Cav1.3−/− mice and impact of DIL in vivo. Retinal manganese uptake profiles of dark-adapted wt mice (closed black circles), Cav1.3−/− mice (closed green circles), or Cav1.3−/− mice + DIL treatment (closed blue circles) on either a C57Bl/6J background (top row) or C57BL/6/SVEV129 F2 hybrid background (bottom row). (A) Wild-type (n = 19) versus Cav1.3−/− (n = 5) mice, (B) Cav1.3−/− (n = 5) versus Cav1.3−/− mice + DIL treatment (n = 5), (C) wt (n = 5) versus Cav1.3−/− (n = 5) mice, and (D) Cav1.3−/− (n = 5) versus Cav1.3−/− mice + DIL treatment (n = 3). Graphs are presented using the conventions in Figure 1. Red lines above profiles indicate retinal regions with significant (P < 0.05) differences in manganese uptake between control and experimental mice indicated.

