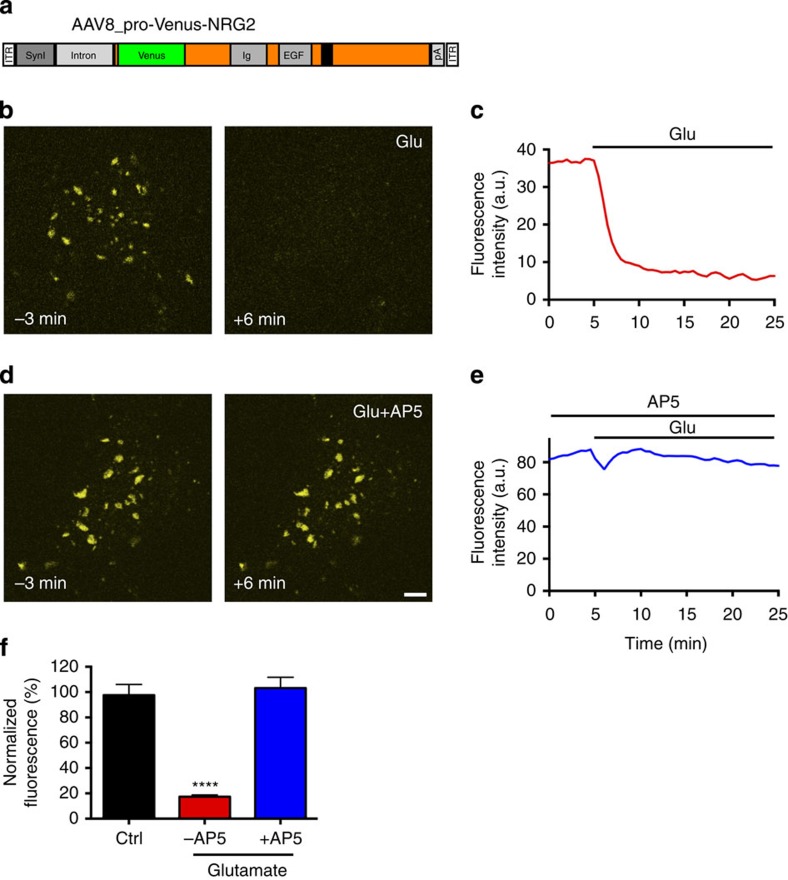
Figure 3. Analysis of glutamate-mediated NRG2 downregulation by live-cell imaging.
(a) Schematic of the AAV construct to express Venus-NRG2 from the neuron-selective human Synapsin I promoter. (b,d) Representative images of live neurons expressing Venus-NRG2, 3 min before (left) and 6 min after the onset of 20 μM glutamate treatment in the absence (b) or presence of 50 μM AP5 (d). (c,e) Line graphs illustrating the time course of fluorescence intensities for neurons shown on the left. (f) Summary analysis of the effects of glutamate acting via NMDARs on Venus-NRG2 fluorescence. Fluorescence intensities are normalized to baseline (−3 min). N=17 (Ctrl), 18, (Glu) and 17 (Glu+AP5) neurons from three independent experiments. Data represent the mean±s.e.m. ****P<0.0001 (one-way analysis of variance). Scale bar, 5 μm. Ctrl, control; Glu, glutamate.

