
Figure 6.
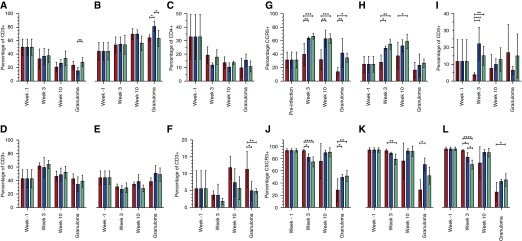
Comparison of lung T-cell phenotype following infection with the different strains. Bronchoalveolar lavage (BAL) cells obtained at Weeks 3 and 10 and dematriced lung cells at necropsy were washed and stained with the various antibodies. Cells were gated into the “lymphocyte gate,” and singlets were obtained and gated for CD4+ (A) and CD8+ (B) subtypes. FoxP3+ Tregs were also enumerated as a subset of CD4+ type (C). Cells were further phenotyped as central memory (D), effector memory (E), and naive (F) populations. Results are shown for wild-type Mycobacterium tuberculosis (red), M. tuberculosis:Δ-dosS (blue), and M. tuberculosis:Δ-dosT (green). BAL cells obtained at Week 10 and dematriced lung cells at necropsy were similarly processed as above. For the various lymphocyte subpopulations, we determined the frequency of CD4+ (G) and CD8+ (H) cells expressing CCR5, CD3+ cells expressing Ki-67 (I), and CD3+ (J), CD4+ (K), and CD8+ (L) cells expressing CXCR3+. Results are shown for WT M. tuberculosis (red), M. tuberculosis:Δ-dosS (blue), and M. tuberculosis:Δ-dosT (green). *P < 0.05; **P < 0.005; ***P < 0.0005; ****P < 0.00005.