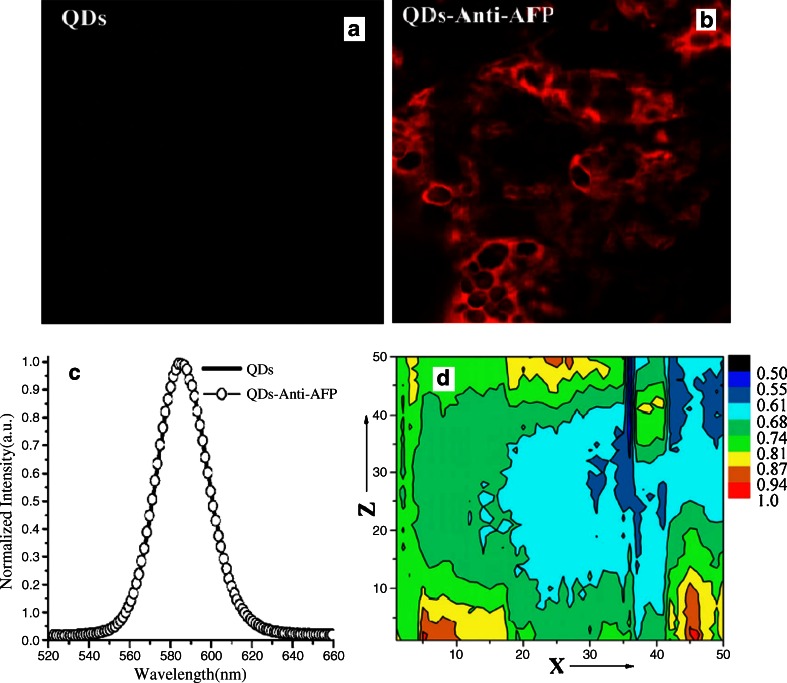
Fig. 12.
Histological examination of QD passive and active targeting ability. a Passive targeting. b Active targeting c Fluorescence spectral comparison between QDs and QDs-anti-AFP. d Fluorescence intensity contour map of a detected cancerous area in the QDs-tagged tumor. Although all the sampling sites are in the tumor, their fluorescence intensities are different and the map exhibits the inhomogeneous distribution of the fluorescence intensities in the detected area of the tumor; (Yu et al. 2007a, b)

