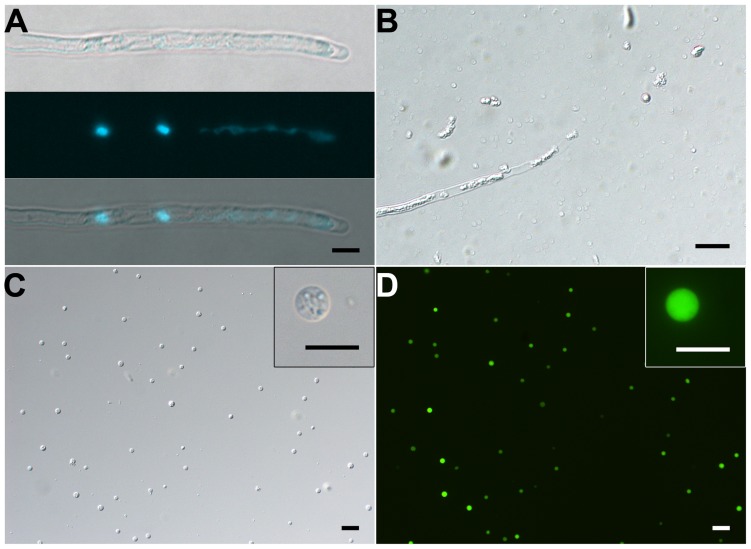
FIGURE 4.
Isolation of SCs from 10-h–cultured pollen tubes. (A) DIC (upper) and DAPI staining (middle) and merged (bottom) images of pollen tube. (B) Representative enzymolysis-treated pollen tubes. (C,D) DIC microscopy (C) and viability of purified SCs with FDA staining (D). The inset images in (C) and (D) are close-ups of the SC. Scale bar: 20 μm in (A) to (D), 10 μm in inset images of (C) and (D).

