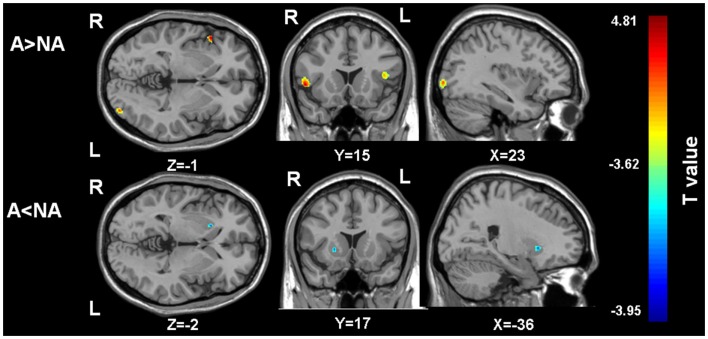
Figure 1.
The regions showing gray matter volume differences between the two groups. A, apathy group; NA, non-apathy group. (Threshold at p uncorrected <0.001 and voxels more than 100). A > NA: the regions showing larger gray matter volumes in the apathy group compared to the non-apathy group. A < NA: the regions showing larger gray matter volumes in the apathy group compared to the non-apathy group.

