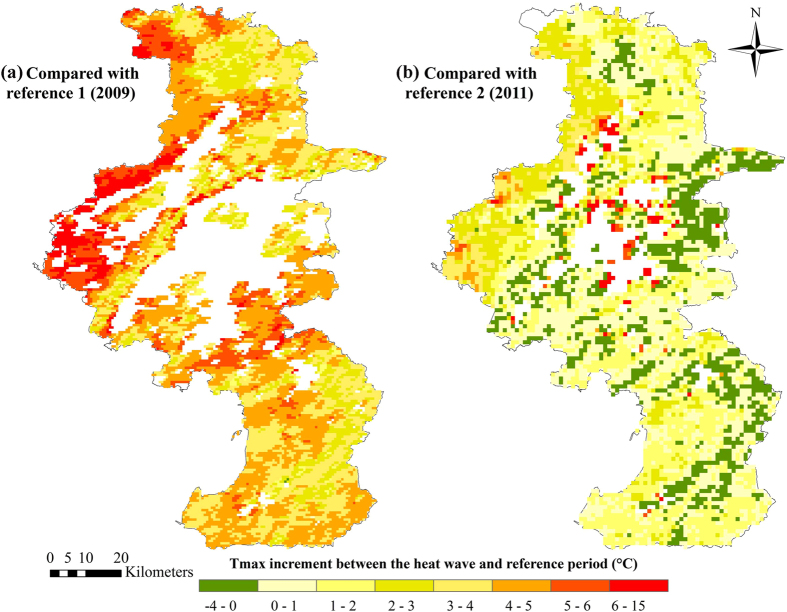
Figure 5. Maximum temperature exposure during the heat wave compared with different reference periods.
(1) Using reference period 1 (A2); (2) Using reference period 2 (A3). Maximum of daytime land surface temperatures (Terra/MODIS, 1 km resolution) in each period (19 days) was used as the temperature exposure indicator. White areas indicate that land surface temperatures were not available due to cloud cover. Maps were generated using ArcGIS (version 10.0; ESRI, Redlands, CA).

