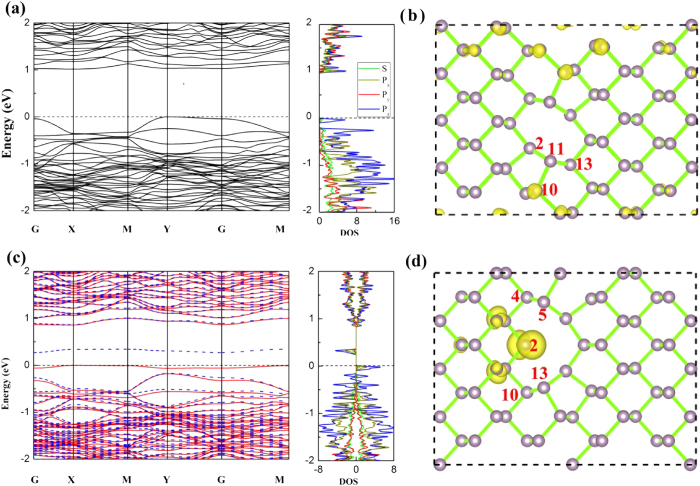
Figure 4. The electronic structure of V1-3 M-BP and V1−3−11 M-BP.
Band structures and partial DOS are shown in (a) and (c), and electron distributions of highest occupied molecular orbital (HOMO) are shown in (b) and (d), respectively. The isovalue of the electron density is set to 0.0025 e/bohr3. The upper panel corresponds to the V1−3, and the lower panel represents V1−3−11 M-BP. The Fermi level is set to zero. The solid red line and the dashed blue of band structures indicate the spin up and down, respectively.

