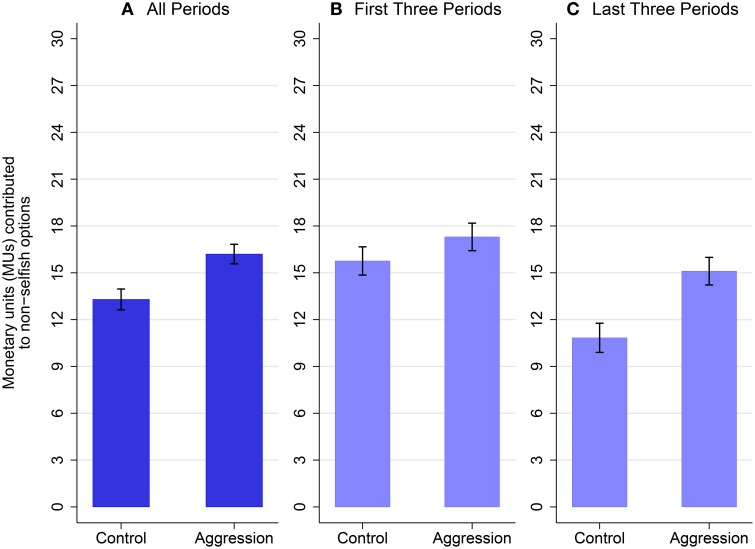
Figure 2.
This figure shows the number of monetary units (MUs) contributed to non-selfish projects (mean ± 1 standard error). Contributions to non-selfish projects are contributions to project A for individuals in the control condition, and contributions to projects A, B, and C for individuals in the aggression condition. The figure shows contributions over all six periods in (A), over the first three out of six periods in (B), and contributions over the last three out of six periods in (C). Over all periods, the possibility to perpetrate aggression increases non-selfish behavior (t = 1.91, 0.05 < p < 0.1, c.f., Table 3 col. 2). The possibility to perpetrate aggression does not increase non-selfish behavior in the early periods (t = 0.86, p > 0.10, c.f., Table S1 col. 3), but it does so in the last three periods (t = 2.60, 0.01 < p < 0.05, c.f., Table S1 col. 4).

