
Fig. 6.
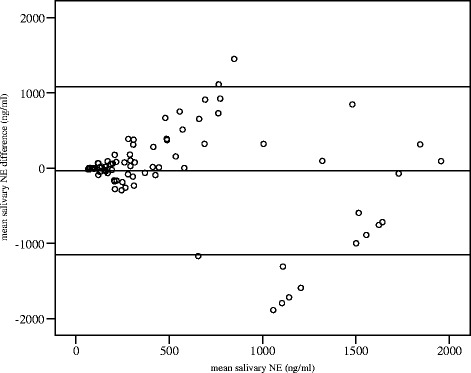
Bland-Altman plot of baseline salivary NE levels across healthy non-smokers, health smokers and stable COPD. The upper and lower bars represent 1.96 Standard Deviations (SD) from the mean. Almost all replicates fell within the 95 % limits of agreement (difference between stable baseline values), with only 7 outliers