
Fig. 9.
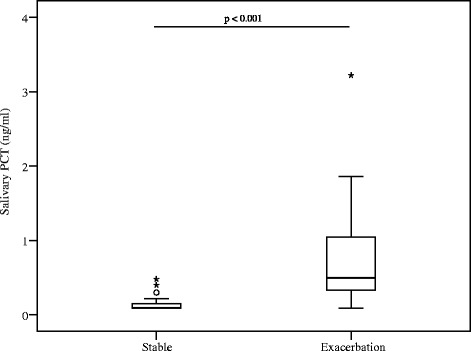
Salivary PCT levels from stable and the same COPD subjects during an exacerbation. The horizontal bar represents the median; the box length represents the interquartile range. Outliers are identified by o (1.5 x the interquartile range) and * (3 x the interquartile range)