
Fig. 2.
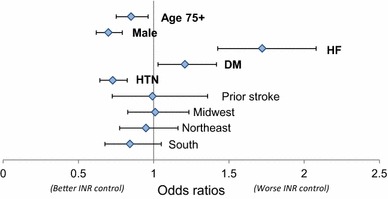
Logistic regression of best versus worst international normalized ratio (INR) control by quartile of patients with out-of-range INR values on demographic and health characteristics. An odds ratio >1 indicated an association with worse INR control, and an odds ratio of <1 indicated an association with better INR control. Reference region with which midwest, northeast, and south were compared: west region. DM diabetes mellitus, HF heart failure, HTN hypertension, INR international normalized ratio