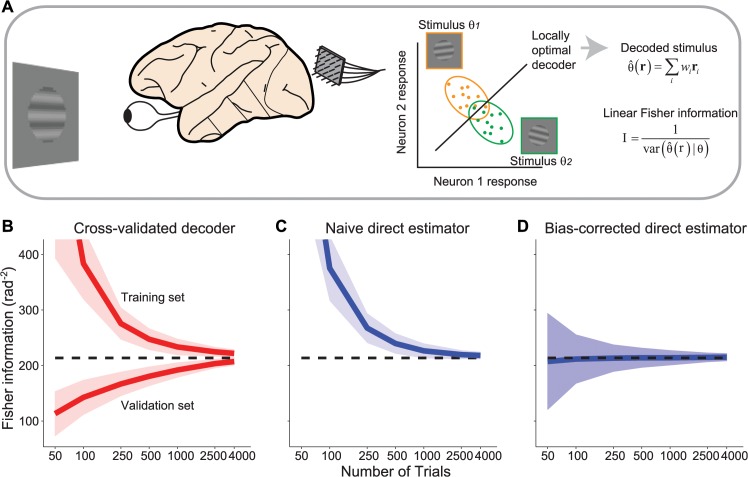
Fig 1. Stimulus decoding and Fisher information.
(a) Left: In a typical experiment, the responses of a population of neurons are recorded simultaneously while a visual stimulus is presented. Middle: Population responses (N = 2 in the cartoon) to two different stimulus values (orange vs. green symbols) are collected over many trials. Right: The optimal decoding weights,w i, are applied to the population response, r, to obtain an estimate of the stimulus, . Linear Fisher information corresponds to the inverse of the variance of such estimates, across trials where the same stimulus was presented. (b) Ordinate: Fisher information in a population of N = 50 model neurons, estimated by a linear decoder as illustrated in (a), using cross-validation with early stopping. Abscissa: number of trials per stimulus condition. We ran 200 experiments for each trial. The top line is the information estimated from the training set; the bottom line is the information estimated from the validation set; the two will converge asymptotically. The dashed line is the true information value in the simulated population. The continuous lines represent the mean, the shaded area represents ±1 std across experiments, computed by bootstrap. (c) Fisher information obtained by directly estimating the tuning curves and covariance, and then applying Eq (11). The continuous lines represent the mean, the shaded area represents ±1 std across experiments, computed by bootstrap. (d) Similar to (c), but after correcting for the estimation bias, according to Eq (2). The continuous lines represent the mean, the shaded area represents ±1 std across experiments, computed analytically using Eq (19).

