
Fig 5. Fisher information estimates when ignoring correlations.
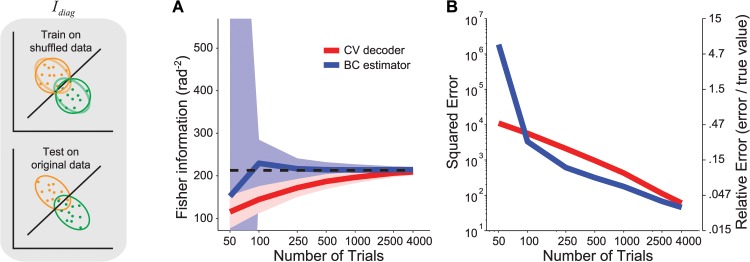
Left: Illustration of the scenario. Decoding weights are optimized for the shuffled data, then tested on the original data. The faint lines on the top plot represent the covariance ellipses of the original data, before shuffling. Note that the decision boundary derived from shuffled data is not necessarily optimal for the original data. (a) Estimate of the Fisher information obtained by decoding (red) or direct estimation with bias correction (blue). The continuous lines represent the mean, the shaded area represents ±1 std across experiments, computed by bootstrap. (b) MSE of the decoder-based estimate (red) and the direct estimator (blue).