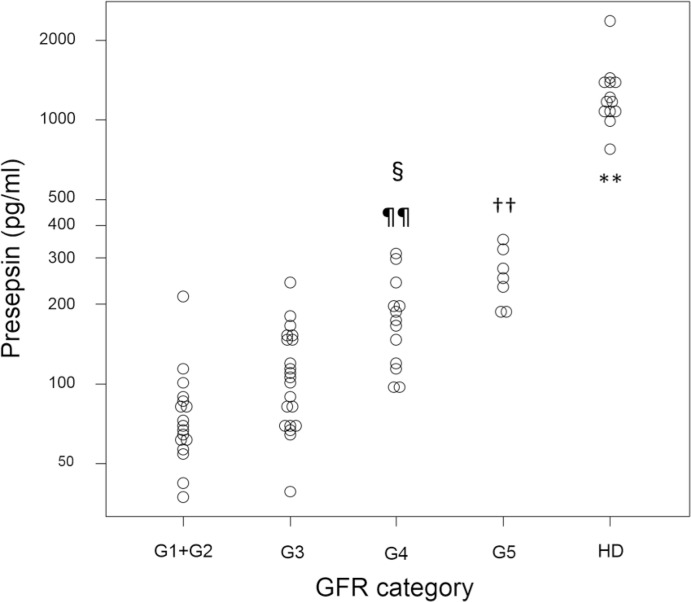
Fig 1. Dot plot of presepsin values of patients in the different GFR categories or of patients receiving HD.
G1: GFR ≥ 90 ml/min/1.73m2, G2: GFR = 60 to 90 ml/min/1.73m2, G3: GFR = 30 to 60 ml/min/1.73m2, G4: GFR = 15 to 30 ml/min/1.73m2, G5: GFR ≤ 15 ml/min/1.73m2, HD: hemodialysis. **P <0.01 compared to any other GFR category. ††P <0.01 compared to G3 and G2+G1. ¶¶P <0.01 compared to G1+G2. §P <0.05 compared to G3.

