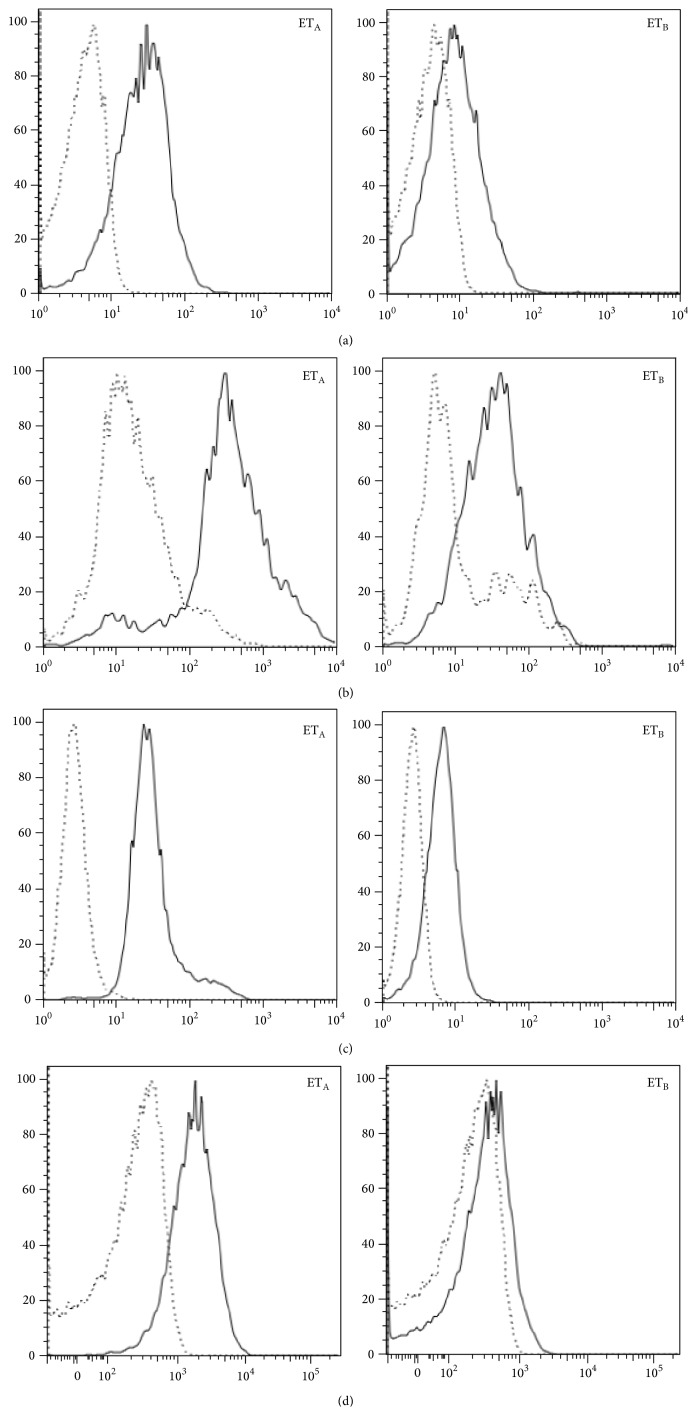
Figure 1.
ETA and ETB expression by cells obtained from SSc patients. The quantification of receptors expression by T (a) and B lymphocytes (b), monocytes (c), and neutrophils (d) is represented by the difference of fluorescence intensity between the sample (continuous line) and its negative control (dotted line). The profile of one of 41 SSc patients is shown. All the other patients had a similar behaviour.

