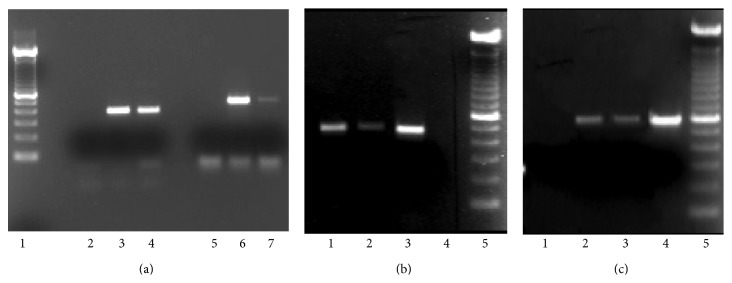
Figure 2.

ETA and ETB transcripts amplified by RT-PCR in fibroblasts, CD4+ T lymphocytes, activated CD4+ T cells, and neutrophils. ETA corresponds to a molecular weight of 446 bp and ETB to a molecular weight of 558 bp. (a) ETA and ETB transcripts amplified by RT-PCR in fibroblasts and neutrophils. Lane 1: molecular weight ladder; lane 2: negative control; lane 3: fibroblasts (ETA); lane 4: neutrophils (ETA), lane 5: negative control; lane 6: fibroblasts (ETB); lane 7: neutrophils (ETB). (b) ETA transcripts amplified by RT-PCR in T lymphocytes, activated T cells, and fibroblasts. Lane 1: T lymphocytes; lane 2: activated T cells; lane 3: fibroblasts; lane 4: negative control, lane 5: molecular weight ladder. (c) ETB transcripts amplified by RT-PCR in T lymphocytes, activated T lymphocytes, and fibroblasts. Lane 1: negative control; lane 2: T lymphocytes; lane 3: activated T cells; lane 4: fibroblasts; lane 5: molecular weight ladder.
