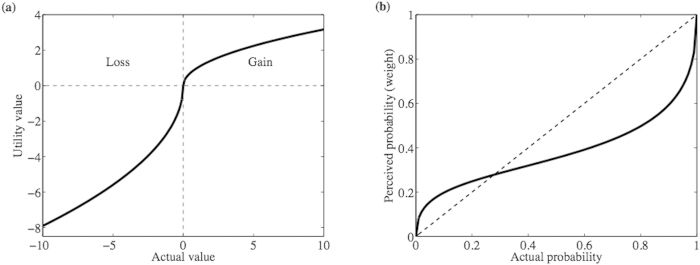
Figure 1. Utility function and probability perception/weight.

(a) The gain and loss utilities of the objective/actual value measured with respect to a reference point. The plot corresponds to the parameters α = .5 and λ = 2.5. (b) The perception/weighting function ω of actual probabilities at parameter value η = .5, see equation (1).
