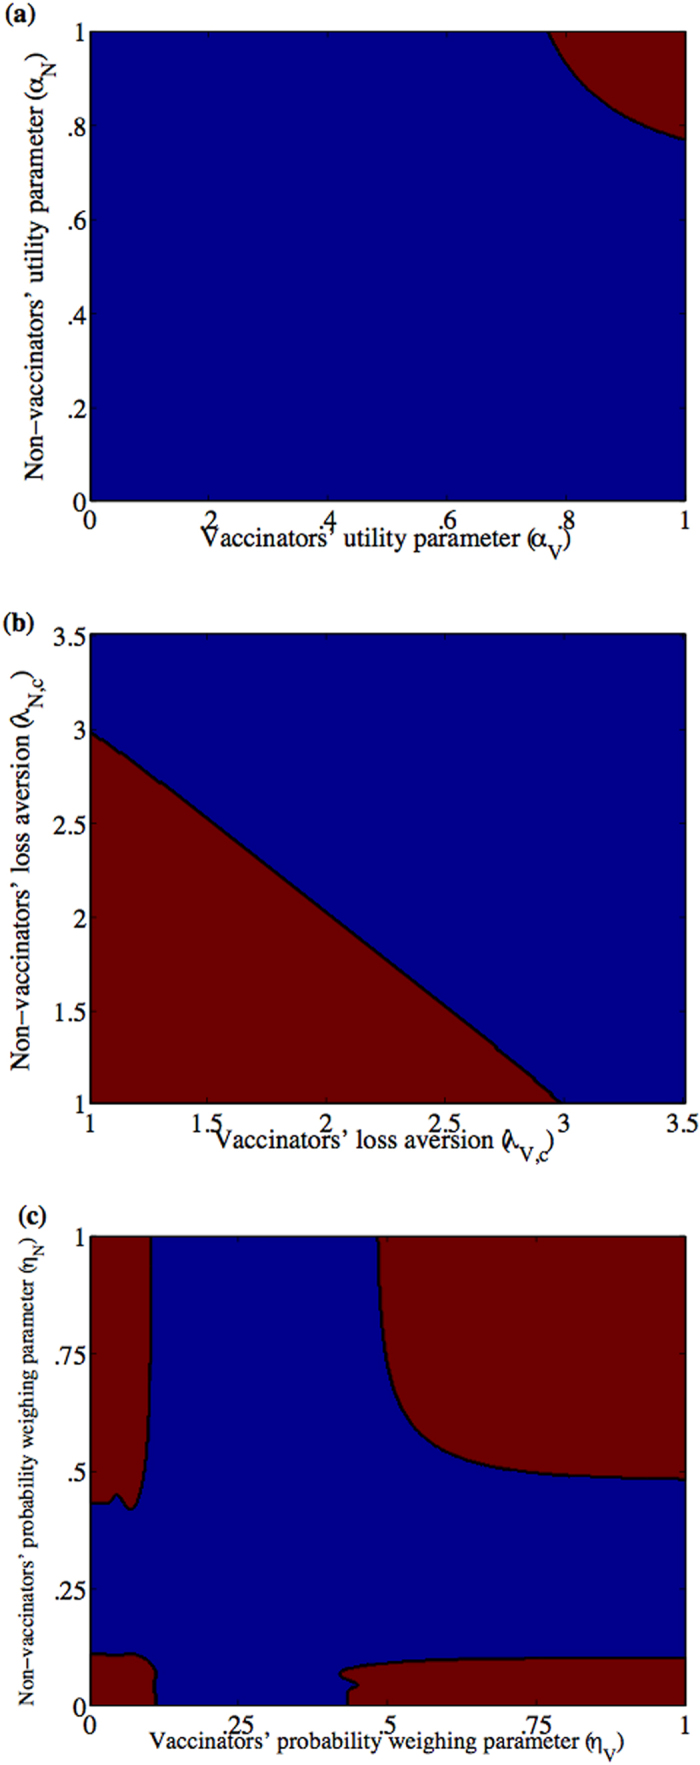
Figure 3. Deviations from the rational decision model influence the vaccine uptake levels.

(a) αV—αN plane, (b) λV,c—λN,c plane with λV,o = λV,c and λN,o = λN,c, and (c) ηV—ηN plane at m = 0 and δV = 0.02. The equilibrium points  (pure vaccinator, disease-free) and
  (no vaccinator, disease-endemic) are stable in the red region which includes the point (1,1)—corresponding to the rational decision model, given the values of the rest of the cognitive parameters equal to one–whereas in the blue region the only stable point is
  . The rest of the parameters are κ = 1.69, c = 1.46, e = .95.
