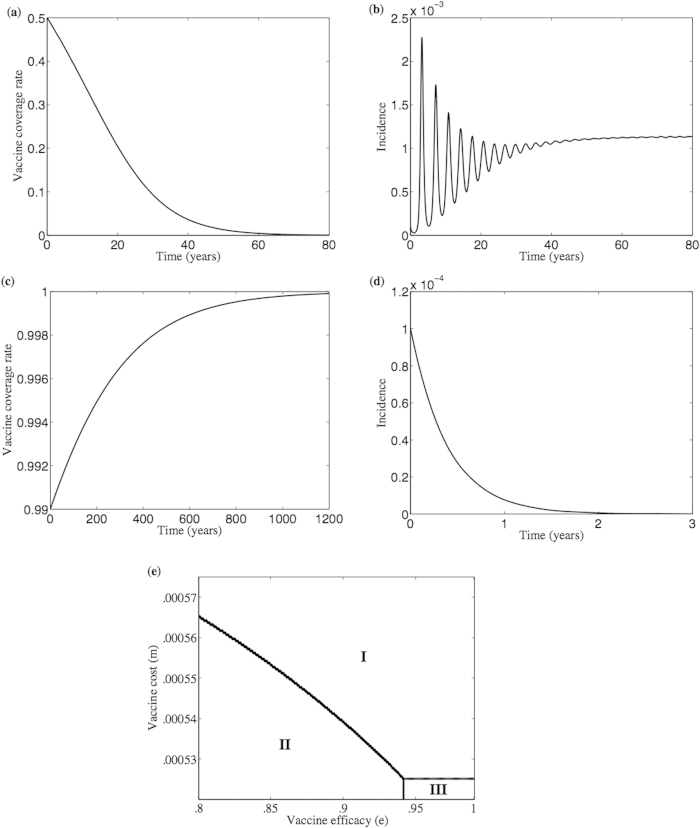
Figure 4. Vaccine acceptance rate and disease incidence depend on the initial vaccine coverage and its efficacy.
Simulation of both vaccine coverage rate (a,c) and disease incidence (b,d) when initial vaccine coverage is 50% (a) and 99% (c) at vaccine efficacy e = 0.95 and cost m = 0 which lie in the extension of region III in subpanel (e) of the e—m plane of a bounded rational model. In (e) there are two bistability regions where the equilibrium points  and
and  are stable in region III, and the equilibrium points
  and
and  are stable in region II. Besides, equilibrium point
  is stable in region I and in an extremely narrow stripe between the two bistability regions II and III. Compare subpanel (e) to Fig. 2(a). The lines in (e) are stability changing bifurcation lines. The rest of the parameters are κ = 1.69, c = 1.46, δV = 0.0725, δN = 0.02, αV = 0.9715, αN = 0.9379, λV,o = 6.9507, λV,c = 9.4554, λN,o = 5.8909, λN,c = 1.9230, ηV = 0.9882, ηN = 0.9362.

