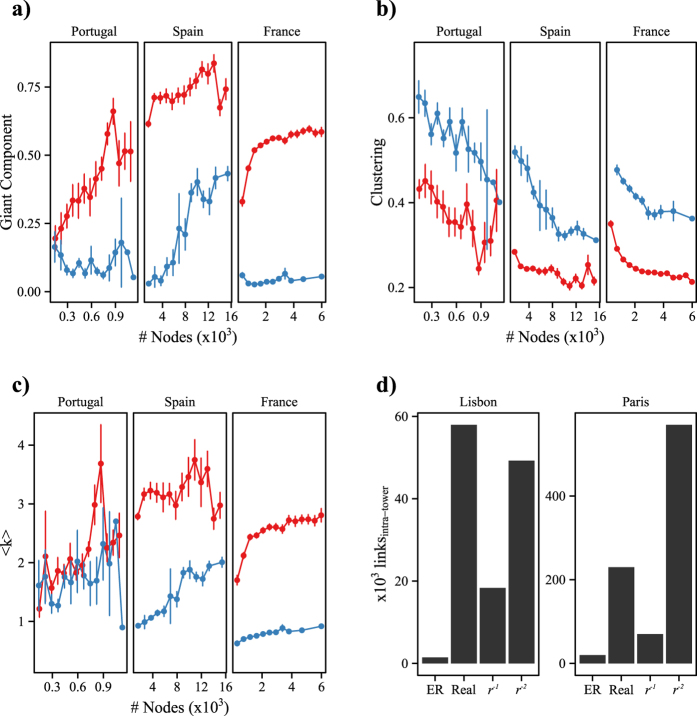
Figure 5.
Connectivity collapse within cities. (a) Relation between population size and fraction of nodes in the giant component for all towers in the capital cities (blue) and municipalities in the country within the same range of population (red). Errors bars represent the standard error of the mean  . The size of the connected components within municipalities tends to be higher than within towers of the same size. (b) and (c) depict the causes of this behavior, smaller average degree and higher clustering are the reasons why the giant component is larger in municipalities. (d) Number of links within the same tower using several randomization models. Results are averaged over
  runs. The real network has a bigger number of intra-tower links than a space independent graph (ER) and a
  model. In the case of Lisbon, the real network has even more links than a
  model. To explain the high number of intra-tower links the geographical distance is not sufficient, thus another effect like clustering is needed.

