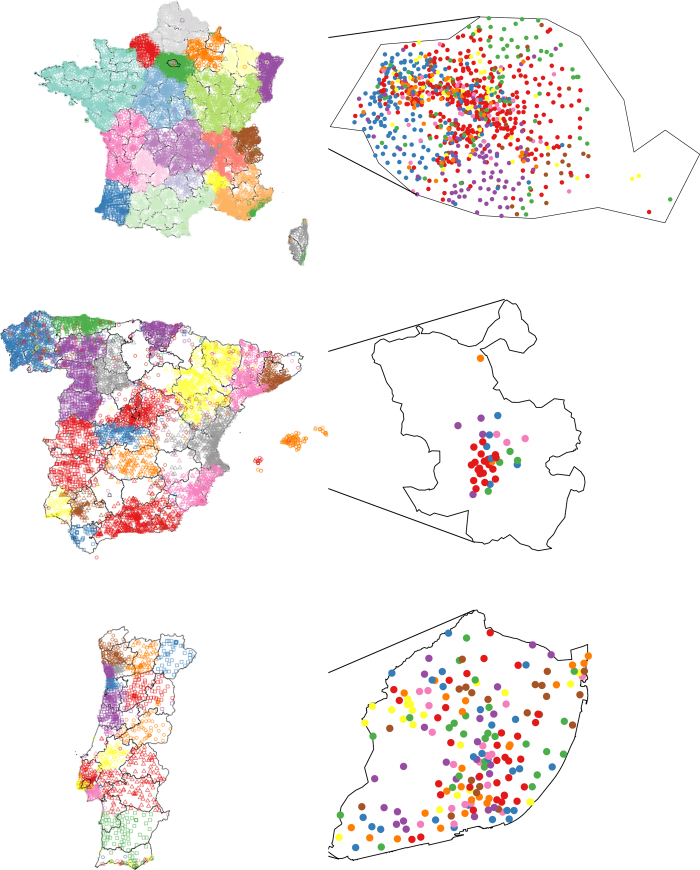
Figure 6.
Geographical clustering of social communities. On the country scale, towers belonging to the 20 biggest communities are presented in different colors and shapes. On the city scale, towers within each capital city are presented. On the country scale most of communities fit with the administrative boundaries while within cities communities do not seem to be geographically driven. The figure was created using R packages maptools and ggplot2.

