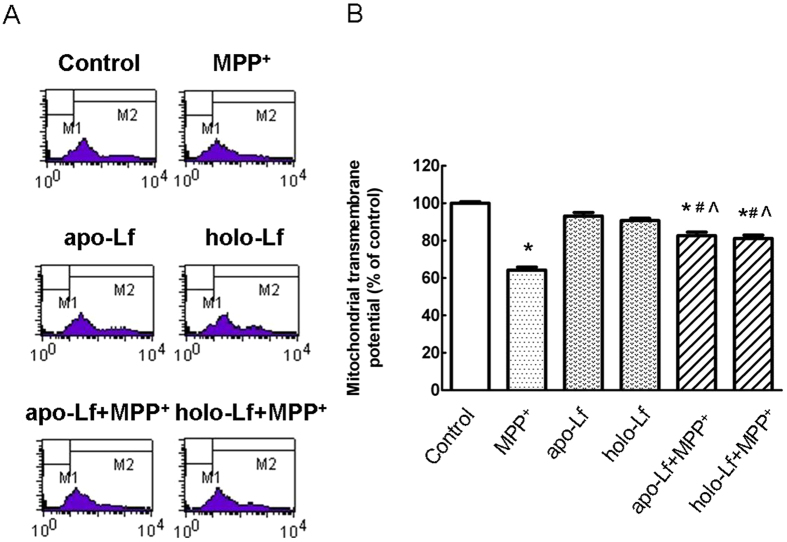
Figure 2. ΔΨm assessed by flow cytometry in MPP+-treated VM neurons with apo-Lf or holo-Lf pretreatment.
Changes in the mitochondrial membrane potential were measured by rhodamine123 using flow cytometry. (A) Representatives of the fluorometric assay on ΔΨm of different groups. Results are shown as FL1-H (fluorescence 1-histogram), setting the gated region M1 and M2 as a marker to observe the changing levels of fluorescence intensity using CellQuest software. Numbers in the M1 gate of the dot-plots show the percentage of apoptotic cells. The ΔΨm was decreased in MPP+-treated apoptotic cells and the ratio of M1 area was increased. 100 ng/ml apo-Lf or holo-Lf pretreatment significantly restored the ΔΨm reduction induced by MPP+, and the frequency of apoptotic cells was decreased. X mean = mean channel fluorescence of FL-1; Y mean= the number of living cells. (B) Statistical analysis. Data were presented as mean ± S.E.M. of three independent experiments. Fluorescence values of the control were set to 100%. *P < 0.05, compared with the control; #P < 0.05, compared with apo-Lf group; ^P < 0.05, compared with holo-Lf group; n = 6.

