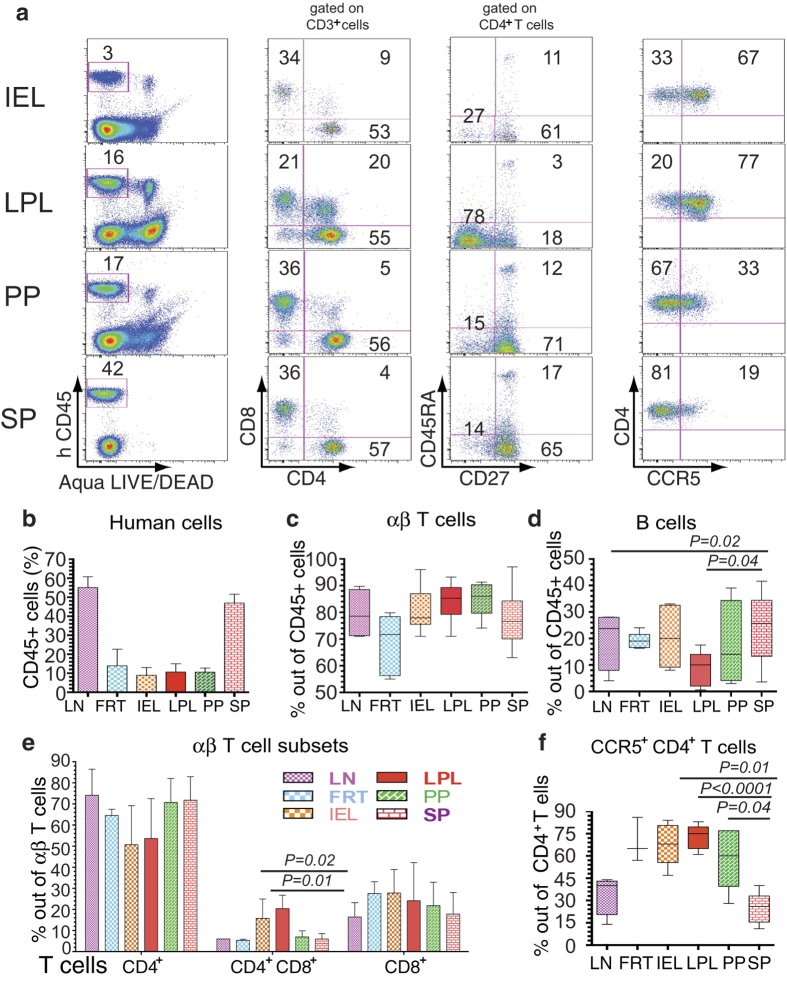
Figure 1. Characterization of human T cell reconstitution in the gut and lymphoid tissues of DRAG mice.
(a) Human hematopoietic cells from IEL, LPL, and PP were harvested from gut and from the SP of individual humanized DRAG mice (n = 3-8). A representative dot plot is shown. Live cells were selected based on Aqua LIVE/DEAD dye and on human CD45 to quantify human-cell reconstitution in each population (% of human CD45+ cells is shown in the left panel). CD3+ T cells were gated on human CD45+ cells and CD3+ T cells were stained for human CD4+ and CD8+ T cells (second panel). CD4+ T cells were stained for CD45RA and CD27 to determine the percentages of naïve CD4+ T cells (CD45RA+CD27+), effector memory CD45RA−CD27−), or central memory CD4+ T cells (CD45RA−CD27+) (third panel). The expression of CCR5 receptor on CD4+ T cells is shown in the last panel. (b) The reconstitution of human hematopoietic cells in the LN (n = 6), FRT (n = 5), gut (IEL, LPL, PP; n = 8)), and SP (n = 8) of humanized DRAG mice are shown as the average % of human CD45+ cells ± SEM. (c) and (d) show the distribution of human T cells and B cells, respectively in LN (n = 4), FRT (n = 5), IEL, LPL, PP (n = 5), and SP (n = 5). (e) The average ± SEM of single and double positive T cells are shown. (f) The percentage of CCR5+ CD4+ T cells in the secondary lymphoid tissues and the gut are shown (LN: n = 4; FRT: n = 3; IEL, LPL, PP: n = 5; SP: n = 5). In (c), (d), and (f) the horizontal bars in the box-and-whisker plots indicate the median values and the vertical lines indicate values from the lowest to the highest. The p values shown in d and f were calculated using Student’s t test.

