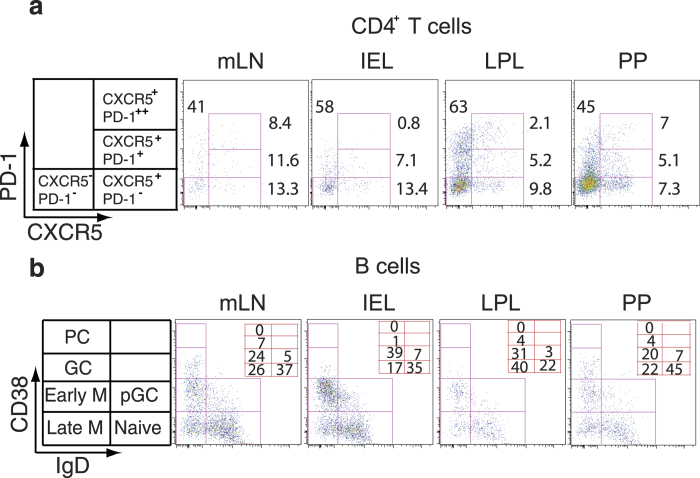
Figure 3. Distribution of TFH cells and B cell subsets in mucosal tissues and lymphoid organs.
(a) Representative flow cytometry dot plots of CXCR5 and PD-1 expression on memory CD4+ T cells showing the distribution of CXCR5+PD-1++, CXCR5+PD-1+, and CXCR5+PD-1− CD4+ T cells. Cells were gated for hCD45 and Aqua LIVE/DEAD then gated for CD3 followed by gating on CD8+ and CD4+ T cells. CD4+ T cells were further gated on CD45RA negative cells. The gated CD4+ CD45RA− T cells were then analyzed for PD-1 and CXCR5 expression. The frequency of CD4+ T cell subsets is shown. (b) Distribution of B cell subsets. B cells (hCD45+CD19+ cells) were stained for IgD and CD38. Naive (CD38− IgD+), pre-germinal center B cells (CD38+ IgD+), germinal center (CD38++ IgD−), early memory (CD38+ IgD−), late memory B cells (CD38− IgD−), and plasma cells (CD38+++ IgD−) are shown in the various tissues analyzed. The numbers represent the frequency of each subset. PC = plasma cells, M = memory B cells, pGC = pregerminal, and GC = germinal center B cells. The experiment was done 3 times for both (a) and (b).

