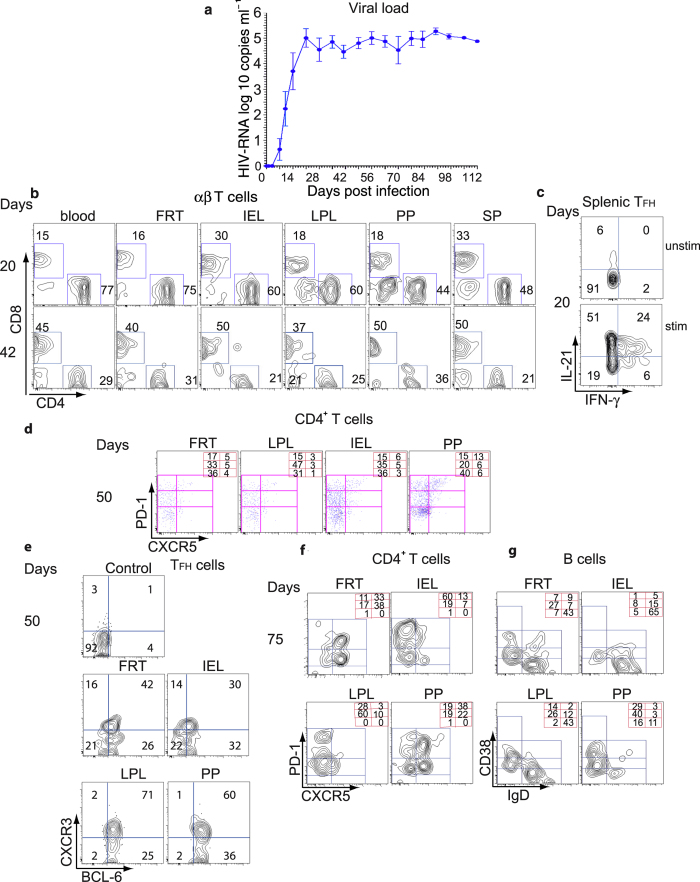
Figure 7. In vivo HIV-1 infectivity of DRAG mice and distribution of mucosal B and T cells after infection.
(a) Viral load in the plasma of infected humanized DRAG mice. Humanized DRAG mice (n = 8) were intravaginally inoculated with a single dose of HIV-1 primary BaL (10,000 Infectious Units/mouse, 2.54 ng of p24). Individual plasma samples from DRAG mice before and after infection were analyzed for RNA viral load (copies per ml plasma) as mentioned in the Methods section using the Abbott RealTime HIV-1 Test. (b) A representative contour plot showing the depletion of human CD4+ T cells from the indicated tissues of HIV-infected humanized DRAG mice at 20 and 50 days post infection. (c) Frequency of IL-21 and IFN-γ producing CXCR5+PD-1++ TFH cells from spleen of HIV-1 infected humanized DRAG mice at 20 days post infection. Cells were stimulated with PMA and ionomycin for 6 hours, permeabilized, and stained with anti–IL-21 and anti–IFN-γ antibodies. Upper panel; unstimulated cells (unstim.). Lower panel; stimulated cells (stim). (d) and (e) Cells were stained for PD1, CXCR5, BCL-6 (intracellular staining), and CXCR3. (d) A representative plot showing the distribution of TFH and pre-TFH cells in the indicated tissues 50 days post infection is shown. The frequency of CD4+ T cell subsets is shown in the right hand corner. (e) TFH cells from (d) were then gated for BCL-6 and CXCR3 expression. Upper left panel shows TFH splenic cells unstained for CXCR3 and BCL-6 (control). (f) A representative flow cytometry contour plot shows the distribution of TFH CD4+ T cells. The numbers at the right hand corner refer to the frequency of CD4+ T cell subsets and (g) the frequency of B cell populations in FRT and gut tissues 75 days post infection. The representative flow cytometry contour plot of B cells is based on the expression of CD19, CD38, and IgD.

