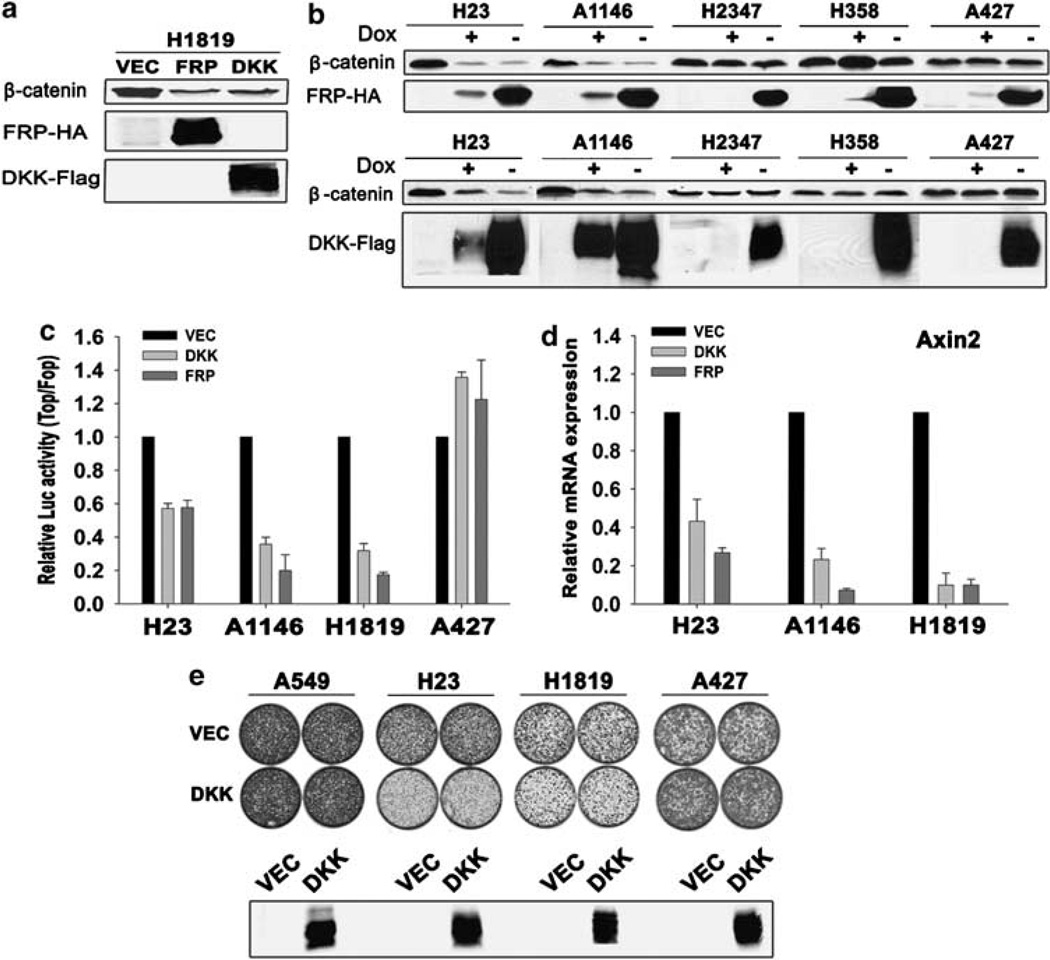
Figure 2.
Effects of FRP1 and DKK1 inhibition on Wnt/β-catenin signaling and growth of human non-small-cell lung carcinoma (NSCLC) cells. (a) Effects of constitutive expression of FRP1 and DKK1 on uncomplexed β-catenin in H1819 NSCLC cell line. FRP1 and DKK1 expression was determined by immunoblot analysis as described in Materials and methods. (b) Analysis of NSCLC lines for uncomplexed β-catenin using regulatable expression of hemagglutinin (HA)-tagged FRP1 (upper panel) and Flag-tagged DKK1 (lower panel). NSCLC cells expressing Tet regulatable FRP1-HA or DKK1-Flag were generated as described in Supplementary materials and methods. Expression of FRP1-HA or DKK1-Flag was induced by removal of dox from the culture medium. Cells expressing tetracycline Trans-activator (tTa) were used as control. Analysis of uncomplexed β-catenin was performed as described in Materials and methods using 1mg total cell lysates, except for A427 cells, where 0.1 mg cell lysate was used. FRP1 and DKK1 expression was determined by immunoblot analysis as described in Materials and methods. (c) FRP1- and DKK1-mediated inhibition of TCF luciferase reporter activity in NSCLC cell lines. Luciferase reporter activity was calculated by dividing the TOP/RL ratio by the FOP/RL ratio. Results were normalized to the results with vector-transduced cultures. The values represent the mean ± s.d. from two independent experiments. (d) Real-time PCR quantification of FRP1 and DKK1 effects on axin2 mRNA expression. H23, A1146 and H1819 cells were infected with vector (VEC), FRP1-HA or DKK1-Flag lentiviruses. qRT–PCR was performed as described in Supplementary materials and methods. Relative mRNA expression levels were quantified using the ΔΔC(t) method (Pfaffl, 2001). (e) Effects of DKK1 on cell growth. A549, H23, H1819 and A427 cells were infected with lentiviruses expressing vector (VEC) or DKK1-Flag and 2 × 10⁴ cells were plated into 60mm tissue culture dishes. Cultures were visualized using crystal violet staining 2–3 weeks after plating. Expression of Flag-tagged DKK1 was assessed by immunoblot analysis as described in Materials and methods.

