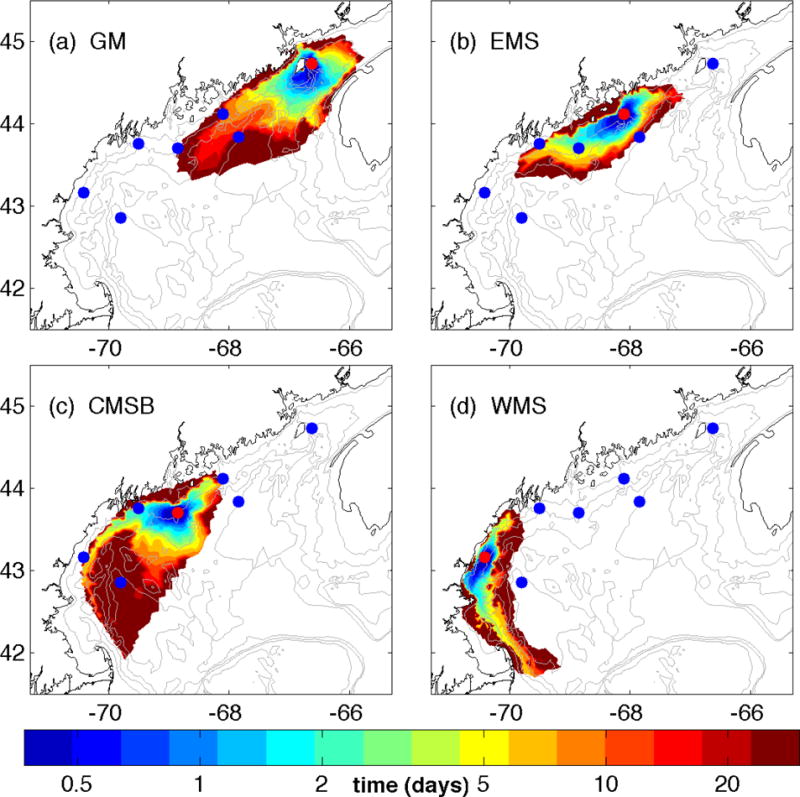
Figure 11.

Spatial distribution for the shortest time (in days) particles spent to reach each location. Particles were resuspended from a) GM; b) EMS; c) CMSB; and d) WMS. Source stations indicated with red dots and the rest of the stations with blue dots. Colorbar shows time in days in a logarithmic scale.
