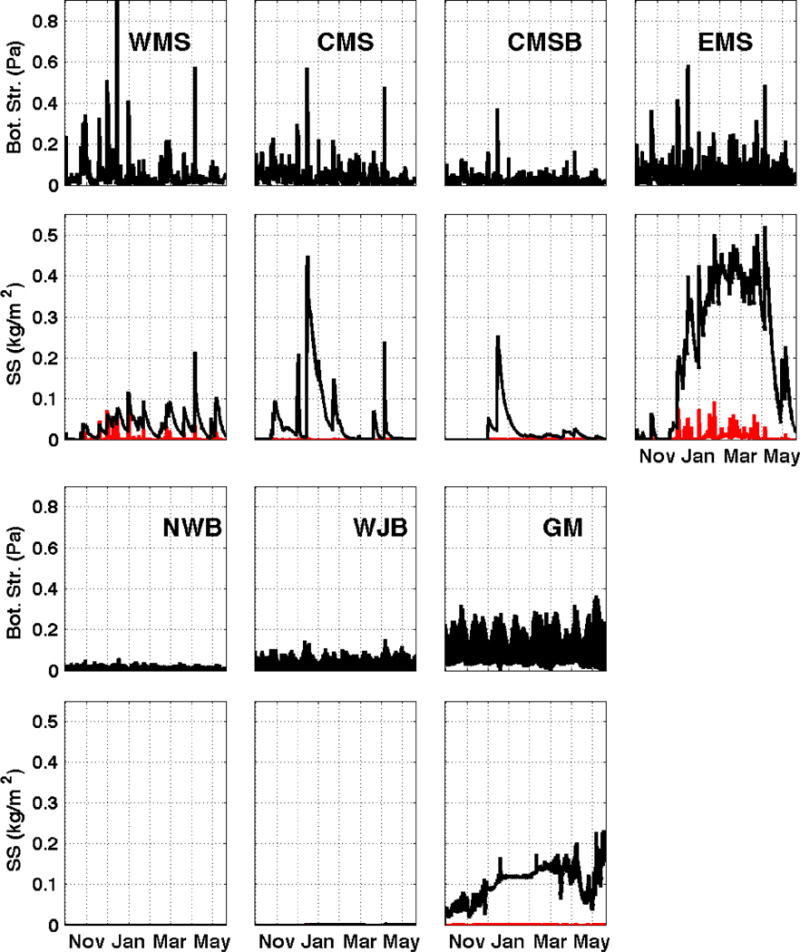
Figure 2.

Results of the resuspension simulation at WMS, CMS, CMSB, EMS, NWB, WJB, and GM for the period October 1, 2010 May 31, 2011. For each station, the top row shows the time series of wave-current bottom stress (in Pa); the second row shows the integrated suspended sediment in the water column (SS) for sand (125 μm, red) and mud (2 and 8 μm together, black).
