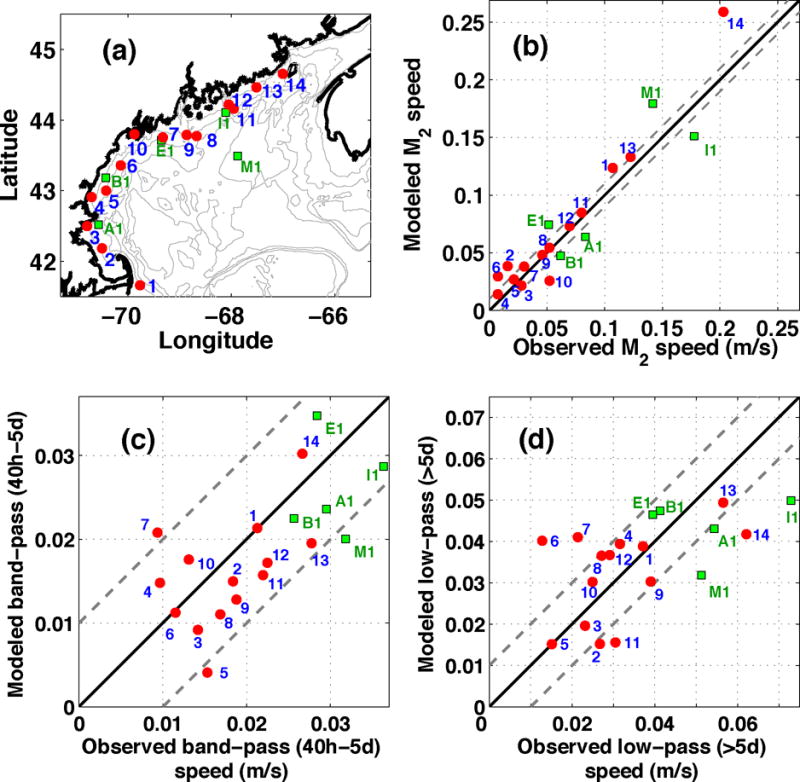
Figure 3.

Model-data comparison with red dots (blue numbers) indicating eMOLT, and green squares showing NERACOOS ADCPs. (a) Location of the stations. (b) Comparison between the observed (x-axis) and modeled (y-axis) M2 tidal constituent speed from a harmonic analysis using t_tide (Pawlowicz et al., 2002). (c) Comparison between the observed and modeled band-pass filtered RMS speed in the band between 40 hours and 5 days. (d) Comparison between the observed and modeled low-pass filtered RMS speed with a 5-day cutoff period. The 1 – 1 line (solid black) and a 0.01 m s−1 error envelope (dashed gray lines) are included in the speed comparisons. Note the speed magnitude scale change between panels.
