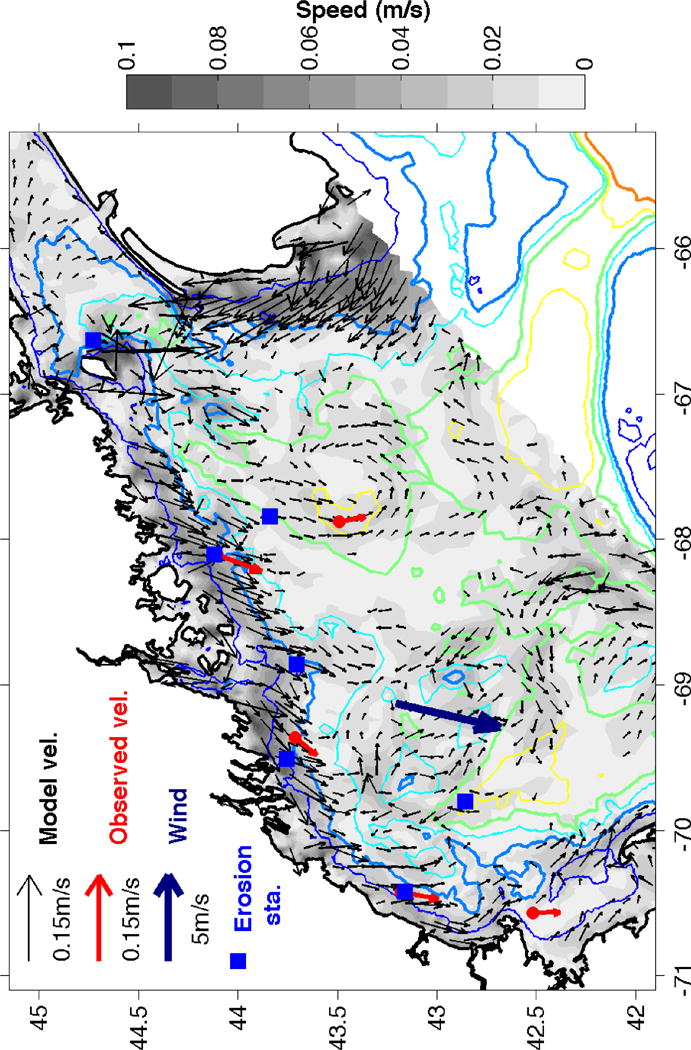
Figure 4.

Average model near-bottom velocities (black vectors) and NERACOOS ADCP observations (red vectors) in the western GoM during storms (defined as times when bottom wave-current stress in excess of 0.1 Pa at WMS). Grayscale indicates speed (m s−1) and only velocity vectors larger than 0.01 m s−1 are shown. The average wind from NDBC Buoy 44005 is included in dark blue. The 50 (blue), 100 (thick blue), 150 (light blue), 200 (thick orange), 250 (yellow), and 500 (thick red) m isobaths are shown.
