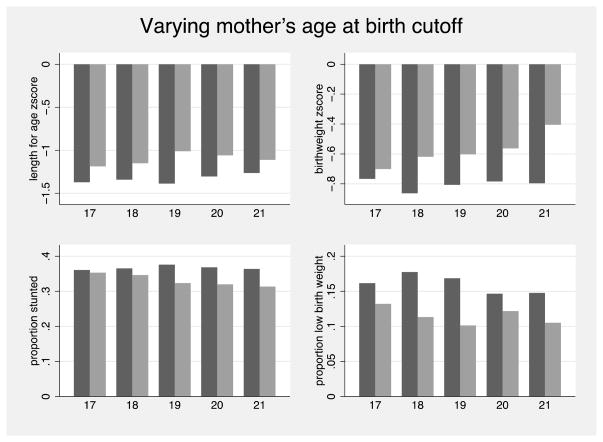
Figure 1.
Notes: The figure presents the average length-for-age and birthweight zscores and the proportion of children born stunted and with low birth weight for children born to teen (black bar) versus older (grey bar) mothers where the definition of teen versus older mother is defined by the age specified on the x-axis.

