Fig. 2.

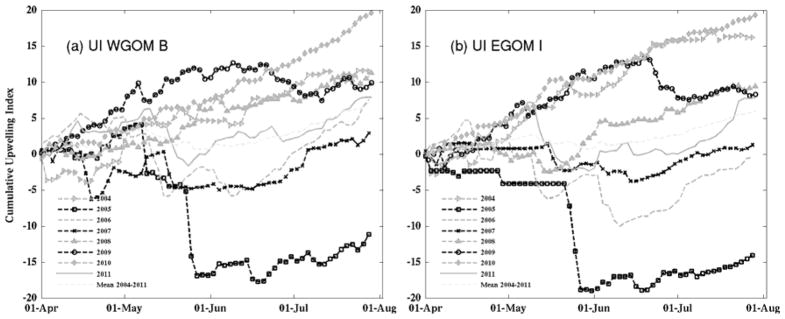
Time series of Cumulative upwelling indices (CUI) for 2004–2011 at (a) WGOM buoy B and (b) EGOM buoy I. The unit for the indices is m2 × 86400. At each station, the long-term mean CUI is shown in dashed grey line.

Time series of Cumulative upwelling indices (CUI) for 2004–2011 at (a) WGOM buoy B and (b) EGOM buoy I. The unit for the indices is m2 × 86400. At each station, the long-term mean CUI is shown in dashed grey line.