
Figure 4.
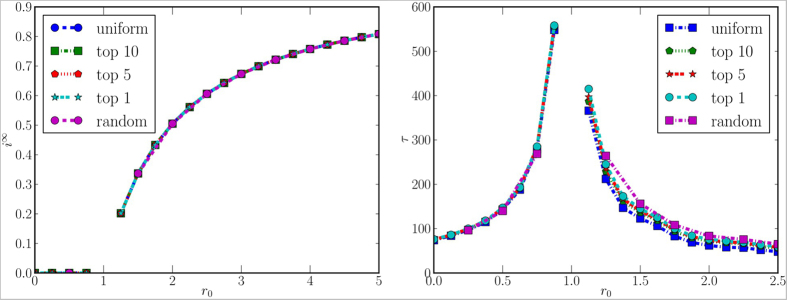
Fraction of infected population at the stationary state (left panel) and time required to reach the stationary state (right panel), for different values of r0 and for different initial conditions. Missing values in the curves mean that, for the corresponding values, no stationary state is reached during the period of observation.