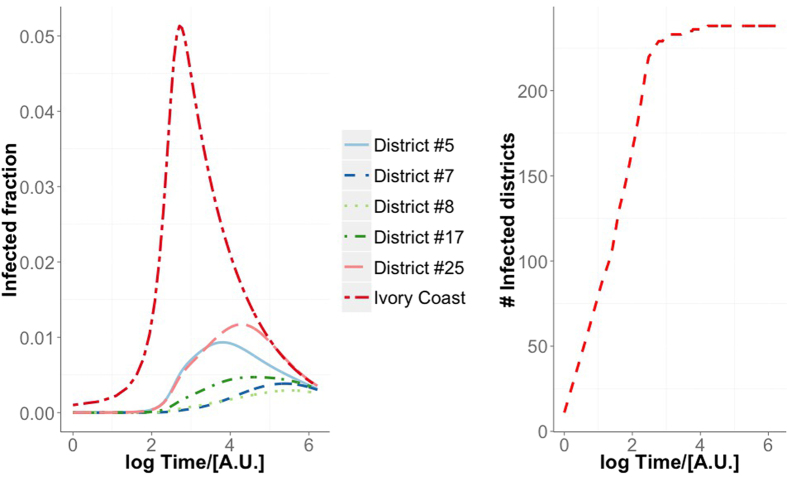
Figure 6.
Spatiotemporal evolution of an epidemics starting form the top ten districts ranked by betweenness centrality ( = 1, γ = 0.5, ω = 0.5, ψ = 0.5, x = 0.5). The fraction of infected individuals is shown for some districts and the whole Ivory Coast versus time (left-hand panel), whereas the number of districts with at least one infected individual is shown on the right-hand panel.

