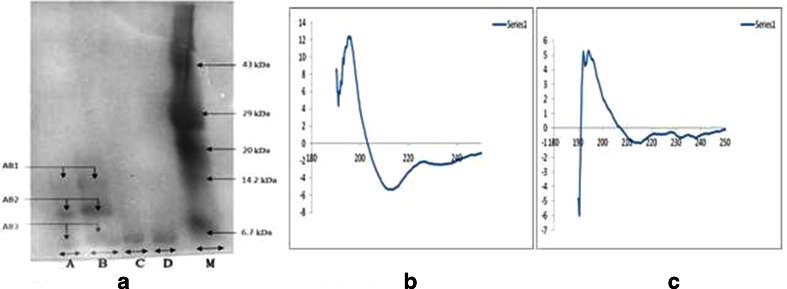
Fig. 1.
PAGE of conjugated sample. M marker, A and B GNP-NKCT1, and C and D native NKCT1. Two types of conjugate were held (AB1, 14 kDa; AB2, 10 kDa). AB3 represents free protein (4–5 %) in conjugated solution (a). CD spectra of secondary structure of NKCT1 upon its conjugation with GNP. b Graph presents the secondary structure of NKCT1 (23 % α helix, 19 % β sheet, and 35 % random coil). c Graph presents the secondary structure of GNP-NKCT1 (43.5 % α helix, 24.5 % β sheet and 32 % β turn)

