Fig. 8.
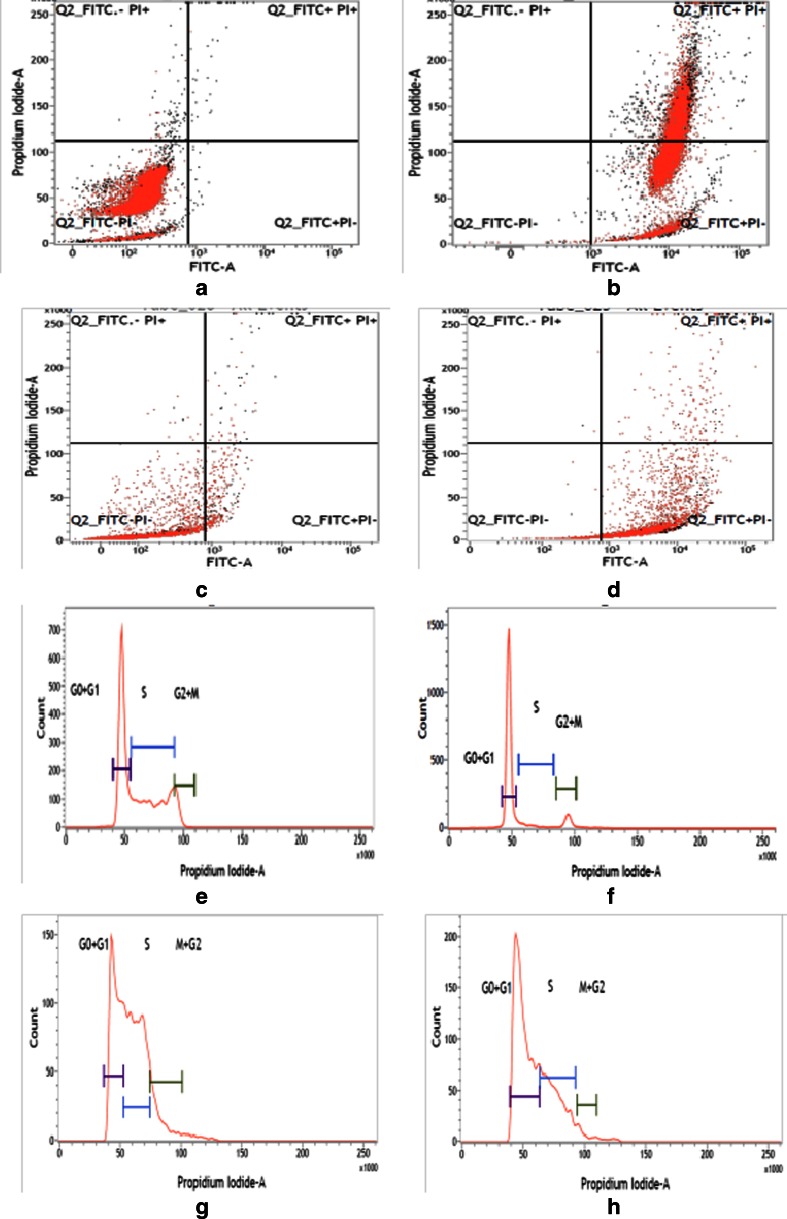
Flow cytometry analysis of U937 and K562 cells stained with Annexin V-FITC-PI, after treatment with NK-CT1. Control U937 cells (a), treated U937 cells (b), control K562 cells (c), and GNP-NKCT1 treated K562 (d). Flow cytometry analysis of cell cycle of untreated control U937 cells (e), GNP-NKCT1-treated U937 (f), control K562 cells (g), and treated K562 cells (h). Histogram of both the treated cell line showed the arrest of cell cycle in G1 phase (x-axis denotes fluorescence intensity of propium iodide and y-axis denotes cell count)

