
Figure 1.
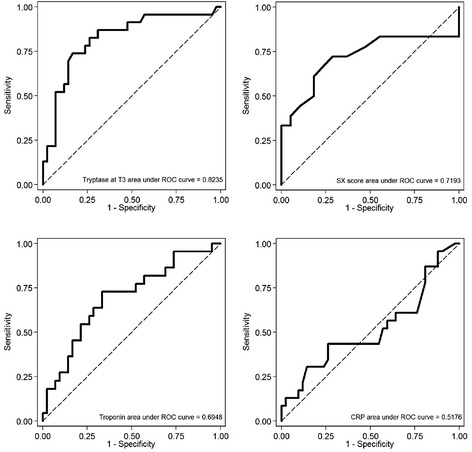
ROC curves reporting AUC calculated at the time of acute event for tryptase, cardiac troponin, CRP, and SX-score, with respect to MACE: AUC of tryptase and SX-score appear significantly higher than the other AUCs. ROC analysis to search for cut-off values of the different markers predictive of MACE.