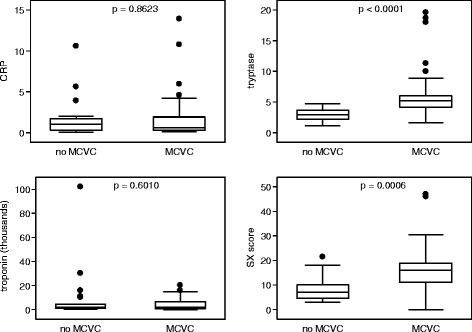
Figure 2.

Box plot for tryptase at T3, CRP, cardiac troponin measurements, and SX-score in MACE and non-MACE patients. The p values were calculated by the Mann–Whitney test. Comparison of the measurements of the analysed markers in patients with and without MACE.
