
Figure 1.
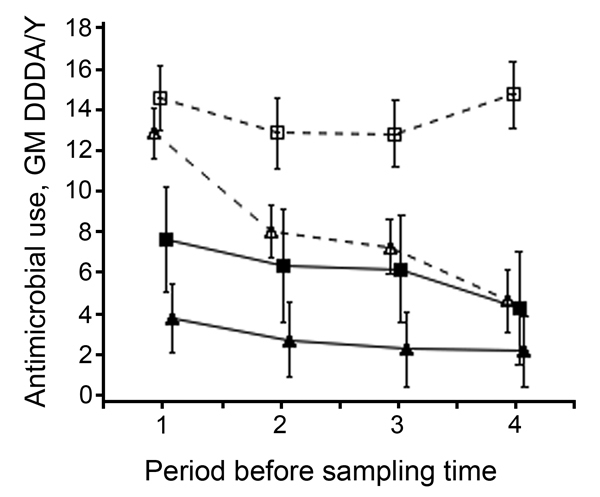
Antimicrobial use by type of farm during the 4 periods (≈6 months) before each sampling time in a study of the dose-response relationship between antimicrobial drug use and livestock-associated methicillin-resistant Staphylococcus aureus on pig farms, the Netherlands, 2011–2013. GM and 95% CI from log2 DDDA/Y. Farms were defined as open when they received external supplies of gilts ≥1 time per year from at least 1 supplier and as closed when they received no external supply of gilts. Closed triangles indicate closed farrow-to-finish farms; closed squares indicate closed farrowing farms; open triangles indicate open farrow-to-finish farms; open squares indicate open farrowing farms. DDDA/Y, defined daily dosages animal per year; GM, geometric mean. Error bars indicate 95% CIs.