
Figure.
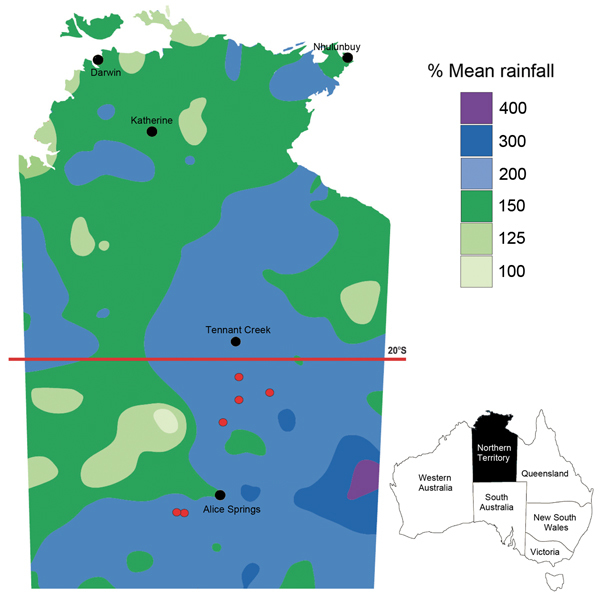
Rainfall in the Northern Territory of Australia during August 1, 2010–July 31, 2011. Rainfall is expressed as percentages of historical mean; the lowest rainfall total was 100% of mean. Cities and towns are indicated by black dots; locations of 6 persons with melioidosis in central Australia are indicated by red dots. Adapted from the National Climate Centre, Australian Bureau of Meteorology (http://www.bom.gov.au). Inset shows location of Northern Territory in Australia.